
The Grid Beneath Everything: A White Paper on Value Arbitrage in Regulated Electric Utilities
How the Infrastructure That Powers Civilisation Is Measured by Accountants, Mispriced by Wall Street, and Understood — Correctly — Only by the People Who Know What It Would Cost to Build It Again

Before We Begin: A Note on the Three Numbers That Never Agree
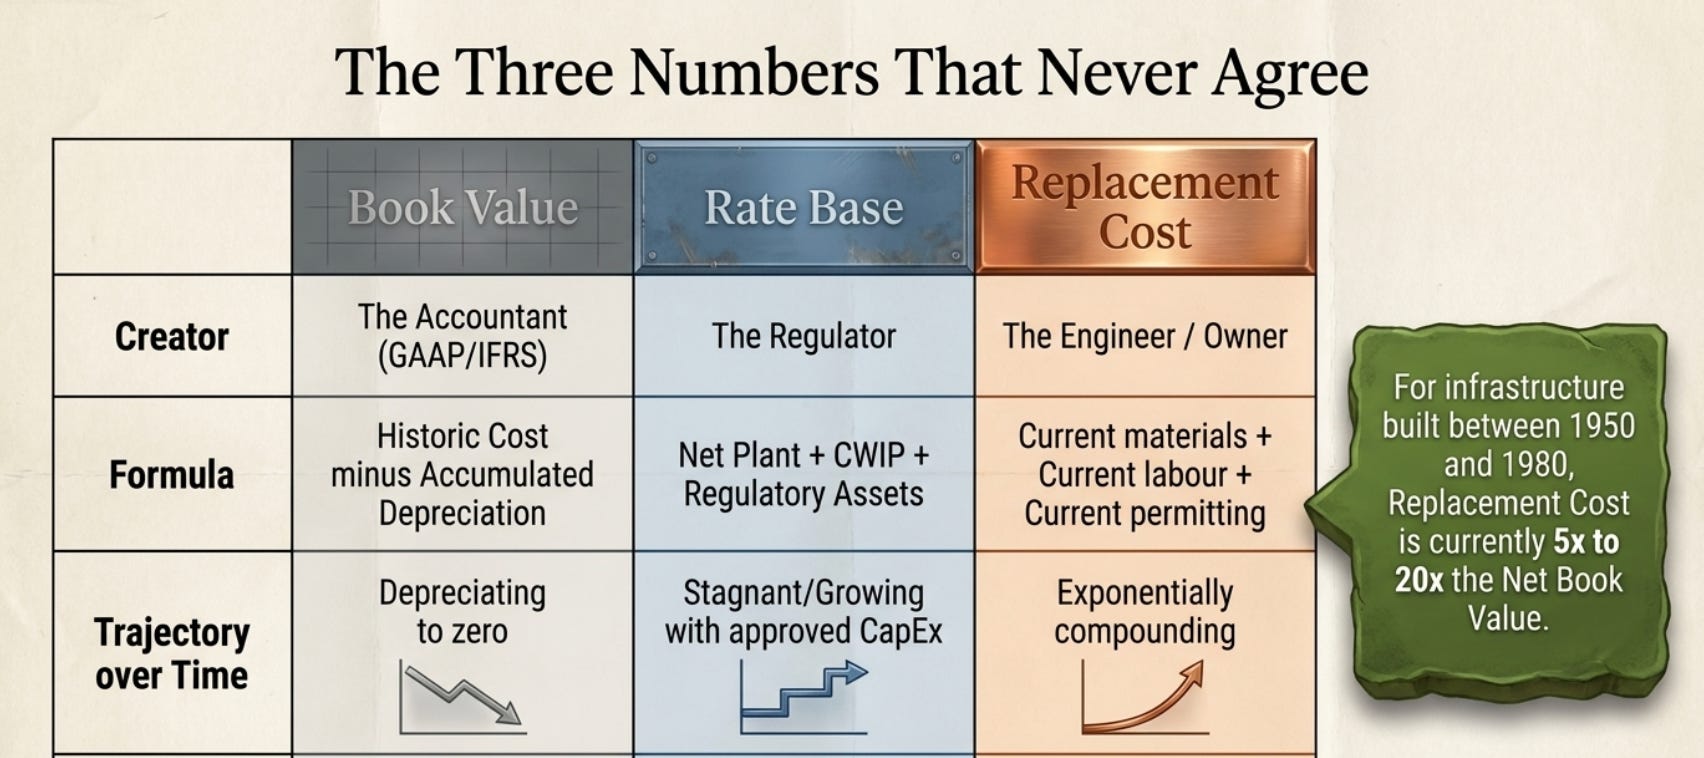
In regulated electric utilities, there are three distinct numbers that all claim to measure the value of the same physical asset — the wires, poles, substations, transformers, generation plants, and hydroelectric dams that make up an electric utility system. These three numbers almost never agree, and understanding why they disagree is the entire intellectual basis of this paper.
The first number is book value: what the utility spent building or acquiring the asset, minus everything that has been depreciated away over the intervening years. A transmission line built in 1970 for $50 million, depreciated over 40 years, might have a net book value of $5 million in 2010 and zero in 2020. The accounting has systematically consumed the asset on paper while the wire continues carrying electricity through the same right-of-way.
The second number is the rate base: the regulatory asset value on which the utility earns its allowed return. This is similar to book value but not identical — regulators allow certain deferred costs, construction work in progress, and regulatory assets to be included, and certain items to be excluded. The rate base is the denominator on which the state public utility commission authorises the utility to earn, typically, 9% to 11% return on equity. In most cases, the rate base is somewhat higher than net book value but still reflects the historic cost paradigm.
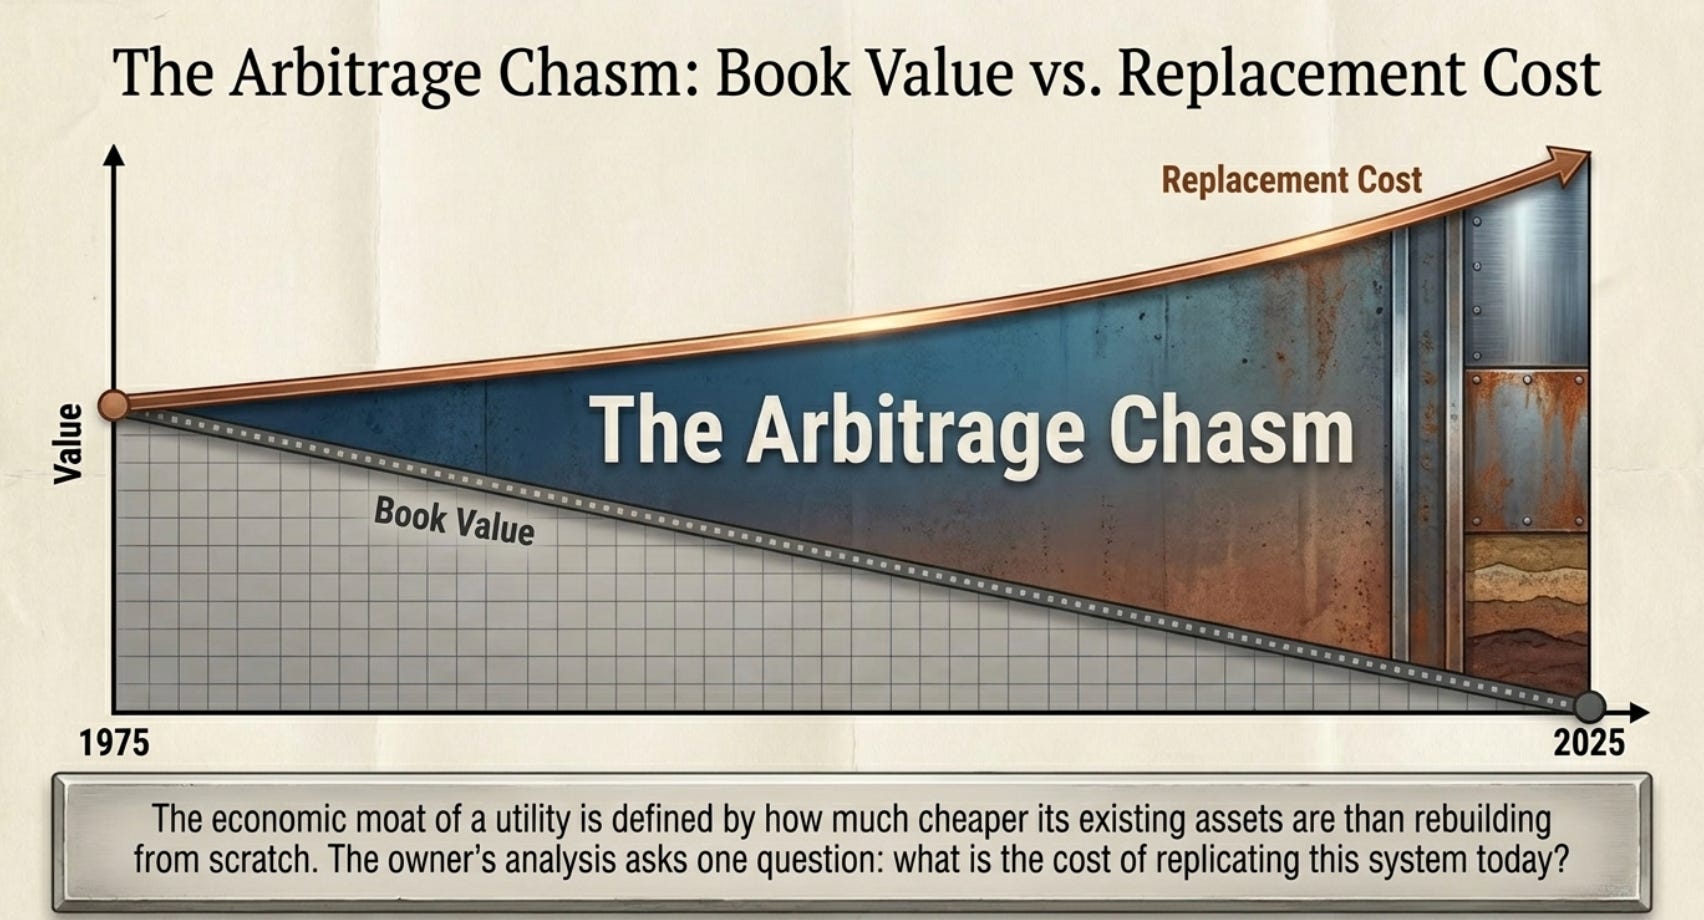
The third number is replacement cost: what it would cost to build the identical asset from scratch today, using current labour costs, current steel and copper prices, current permitting and environmental compliance requirements, and current right-of-way acquisition costs. For infrastructure built in the 1950s through 1980s — during an era of cheap steel, cheap labour, and minimal environmental permitting — the replacement cost in 2026 can be 5 to 20 times the current net book value.
The owner’s analysis asks one question: which of these three numbers is relevant for deciding what the asset is worth to someone who wants to buy it today? The answer is obvious once stated: replacement cost. Because if a competitor wanted to provide the same service by building new infrastructure, they would have to spend the replacement cost. The existing asset’s competitive value — its economic moat — is defined by how much cheaper it is than rebuilding from scratch. No amount of accounting depreciation changes the cost of the steel and labour required to replicate the wire in the ground.
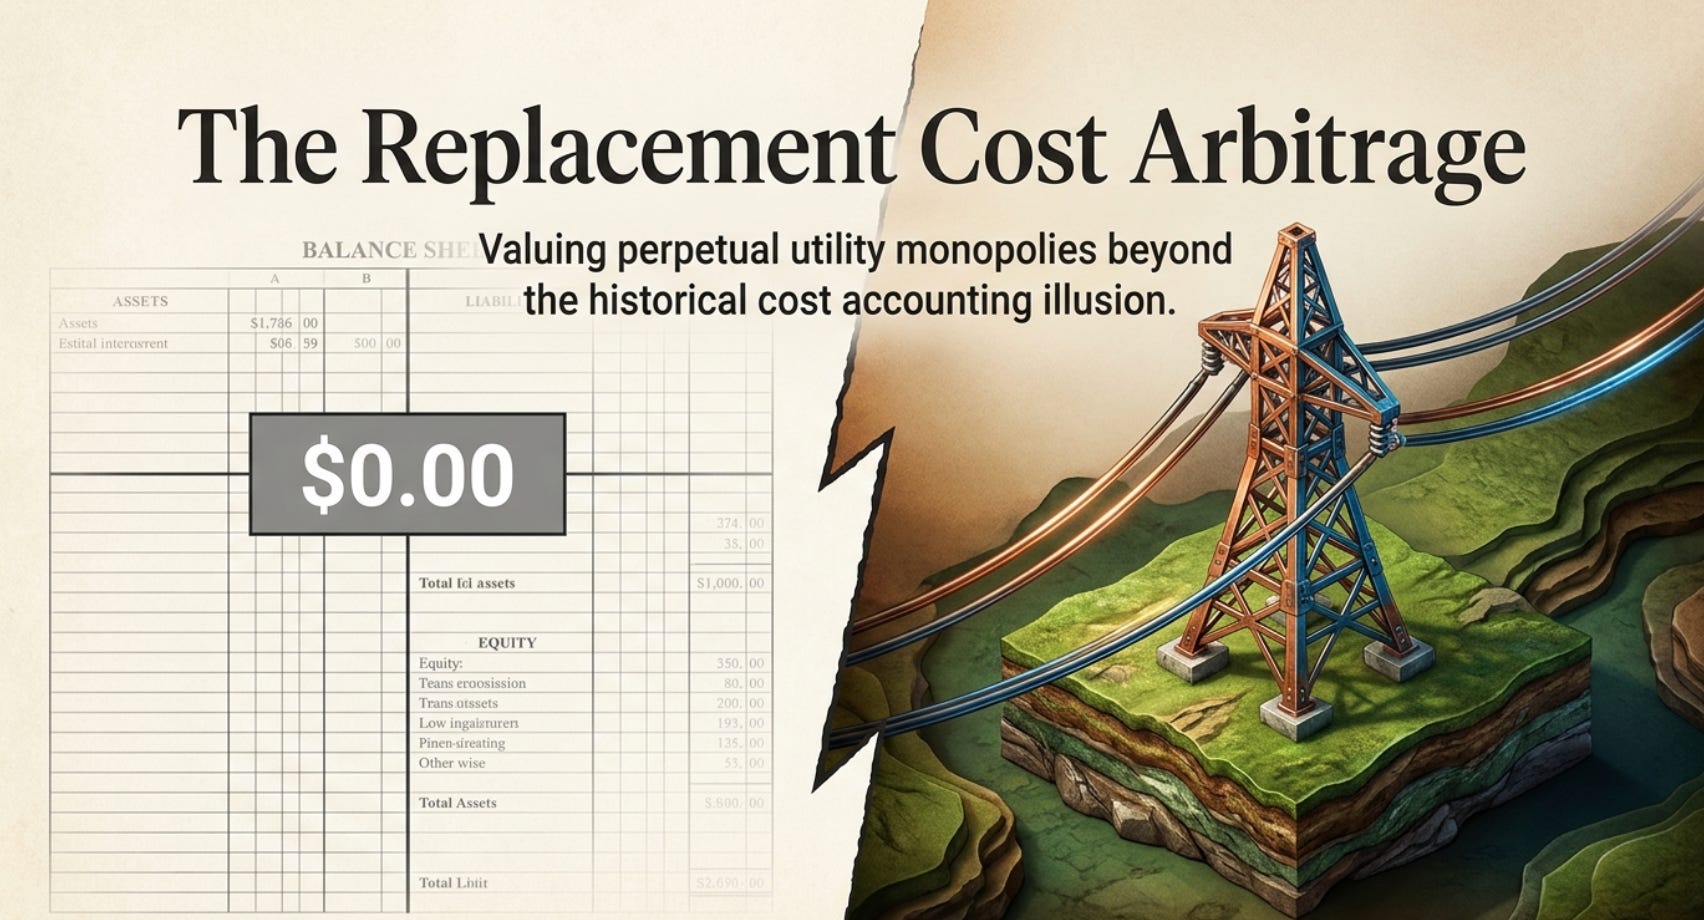
This paper is about the gap between what the accounting records, what the financial model produces, and what the replacement cost reveals.
PART I: THE REGULATED UTILITY BUSINESS MODEL, FROM FIRST PRINCIPLES
A Monopoly with a Social Contract
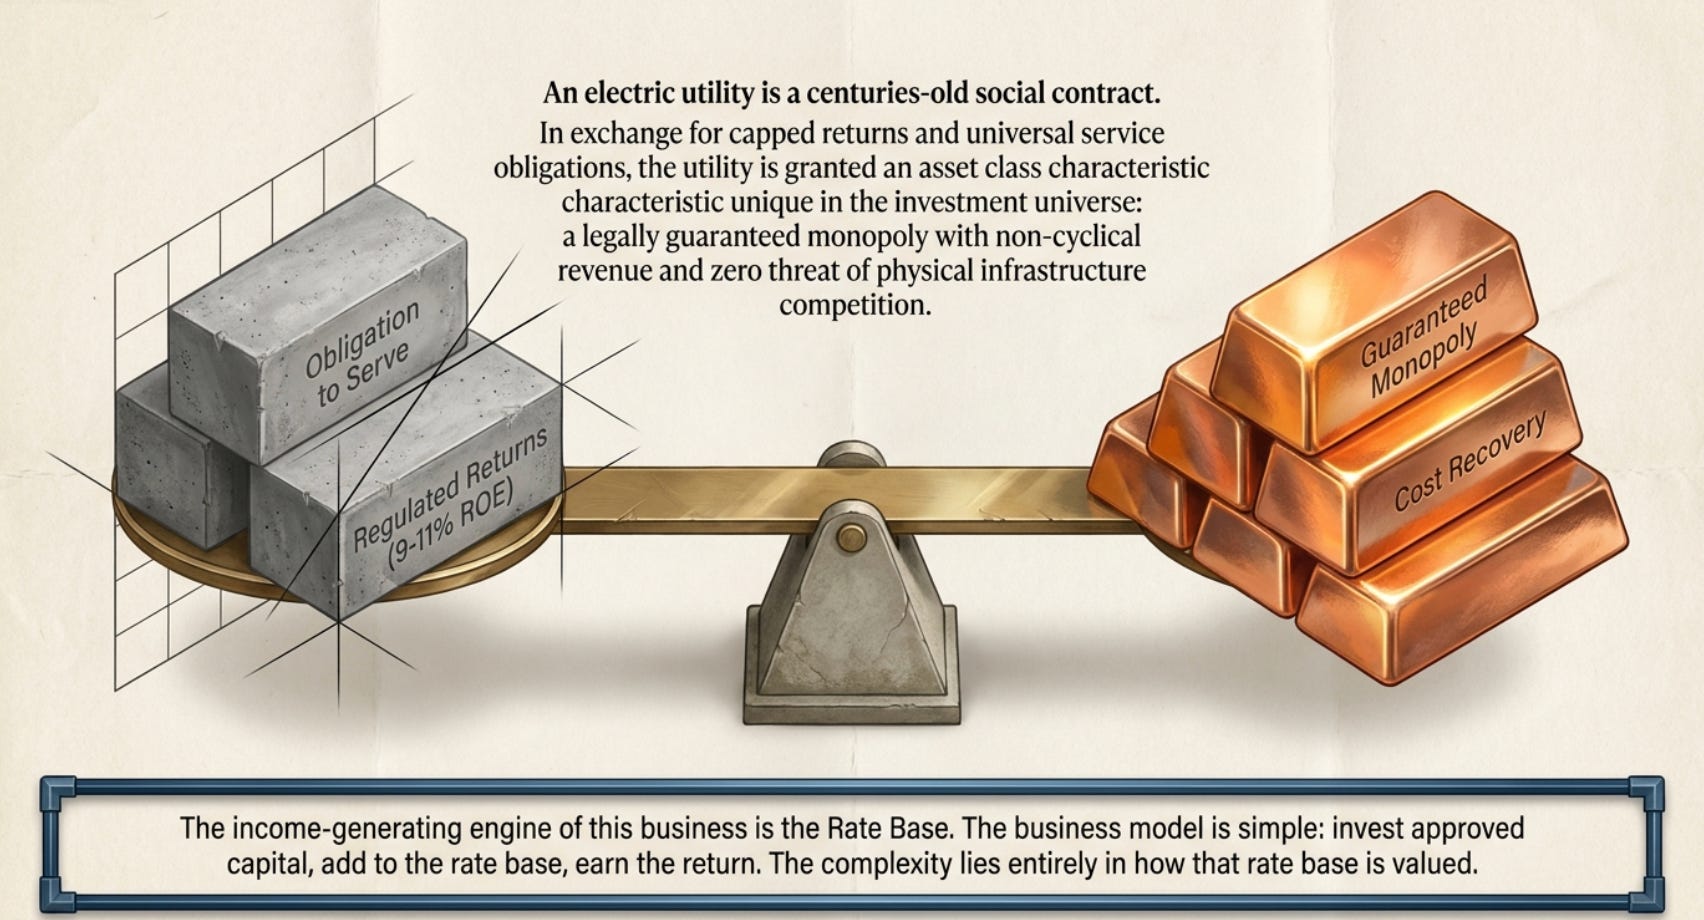
An electric utility is not a normal business. It is a regulated monopoly operating under a social contract that is centuries old and deeply embedded in American law, politics, and culture. The contract has two sides. The utility agrees to serve every customer in its territory who asks for service, at rates set by a regulator, without the ability to raise prices unilaterally or refuse service to unprofitable customers. In exchange, the regulator agrees to set rates high enough to allow the utility to earn a reasonable return on its invested capital — the rate base — and to recover all prudently incurred operating costs. The regulator also guarantees the utility’s service territory against competition: no other company can string wires and serve the same customers.
This arrangement sounds restrictive, but it creates an asset class with characteristics that are genuinely unusual in the investment universe. The revenue is not cyclical — people use electricity regardless of the economic cycle, and the regulator must allow the utility to recover its costs. The customer base is captive — there is literally nowhere else for a residential customer in Columbus, Ohio or rural Louisiana to buy electricity. The rate of return is guaranteed by law — a regulator who routinely allows utilities to earn below their cost of capital will eventually face service deterioration, utility bankruptcy, and the political consequences of failing infrastructure. And the physical assets — the grid infrastructure — are monopolistic in the most profound sense: they cannot be replicated by a competitor even if that competitor had unlimited capital, because the right-of-way for a second set of transmission lines simply does not exist in most markets.
The income-generating asset of this business is the rate base — the sum of invested infrastructure on which the regulator allows the utility to earn its authorised return on equity. Every dollar the utility spends building or upgrading infrastructure, if approved by the regulator as prudently incurred, becomes part of the rate base. The rate base earns the allowed return, which flows through to the utility’s shareholders as earnings. The business model is simple: invest capital in approved projects, add it to the rate base, earn the authorised return, repeat. The complexity lies not in the business model but in the gap between what the rate base records and what the physical infrastructure is actually worth.
Rate Base Is Not Replacement Cost — And That Gap Is Growing
The rate base formula, as understood in US regulatory accounting, is approximately: gross plant in service minus accumulated depreciation, plus construction work in progress, plus regulatory assets, less regulatory liabilities, plus working capital. This is a compilation of historical investments, adjusted downward for depreciation charged over time and upward for regulatory timing differences.
What rate base is decidedly not is replacement cost. The electric distribution infrastructure of a major US city — the underground cables, the pad-mounted transformers, the feeder substations, the service connections to individual buildings — was built over a period of decades, often primarily in the 1960s through 1990s. The construction costs at that time reflected the steel prices, labour rates, permitting requirements, and equipment costs of those decades. A distribution transformer that cost $3,000 to install in 1975 might cost $15,000 to replace today. A mile of underground distribution cable that cost $200,000 per mile in 1985 might cost $1.2 million per mile today in a dense urban environment, given labour rates, street opening permits, traffic control requirements, and equipment costs. The rate base carries the 1975 transformer at its historical cost minus 45 years of depreciation — approximately zero. The replacement cost of that transformer is $15,000.
The Electric Energy Institute, in its analysis of US utility capital spending, noted that approximately 70% of North America’s electric infrastructure is more than 25 years old. In 2024, EEI member utilities invested a record $186.4 billion in capital expenditure — the twelfth consecutive year of record capital spending — and the 2025 figure is projected to be $214.7 billion, a 24% increase. This accelerating investment reflects two realities simultaneously: first, the aging infrastructure is being replaced at costs that are dramatically higher than the historical costs at which it was originally built; second, the rate base is growing rapidly because new investment at higher current costs is flowing in, while the old cheap infrastructure depreciated away long ago. The replacement of old, cheap, fully depreciated assets with new, expensive assets at current prices is systematically increasing the rate base — and the replacement cost of the combined system — faster than any financial model based on historical cost accounting can capture.
PART II: THE ACCOUNTING TREATMENT AND THE GAP IT CREATES
What GAAP Records About a Transmission Line Built in 1975
Under US GAAP (ASC 980, which governs regulated operations) and IFRS (IAS 16 with regulatory deferral under IFRS 14), electric utilities record their plant and equipment at historical cost minus accumulated depreciation. The standard utility accounting treatment uses a composite depreciation method — each category of plant (transmission structures, conductors, transformers, substations) is depreciated over its estimated useful life, which regulators typically set at 30 to 50 years for most major infrastructure categories.
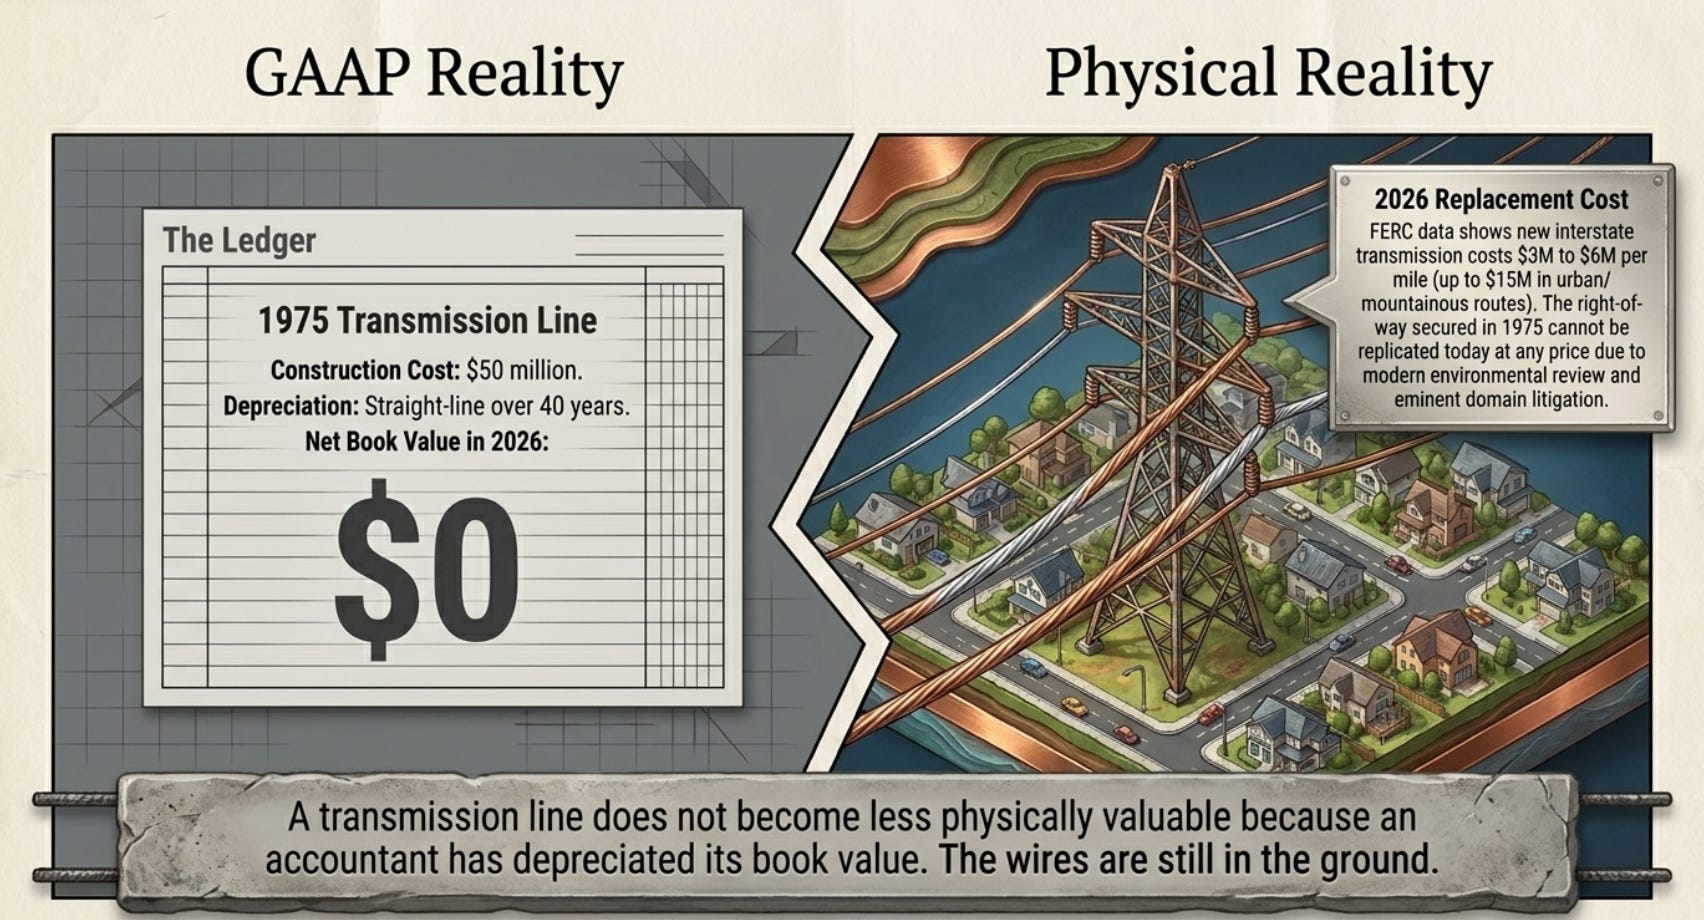
A transmission line built in 1975 at a construction cost of $50 million, depreciated over 40 years on a straight-line basis, would be fully depreciated by 2015. If still in service in 2026 — which many such lines are, because properly maintained steel towers and ACSR conductors can last 60 to 80 years or more — its net book value is zero or near-zero. The rate base may carry a small residual value if regulators have allowed deferred recovery of certain costs, but it is still a small fraction of the asset’s economic importance.
The replacement cost of that same transmission line in 2026 is a different number entirely. Right-of-way acquisition costs in 2026 are not comparable to 1975 costs, because environmental review requirements, eminent domain litigation costs, and landowner compensation expectations have all increased dramatically. Steel prices and fabrication costs for transmission structures are higher. Skilled labour for high-voltage transmission construction is scarce and expensive. Project management, engineering, and permitting for a major transmission line now typically takes 7 to 15 years from initial routing study to energisation — and that timeline has a cost that the 1975 comparison line did not incur in anything like the same magnitude.
The Federal Energy Regulatory Commission (FERC) has published data showing that the cost of new interstate transmission in the United States has increased from approximately $1 million per mile for a 345-kV line in the late 1990s to $3 million to $6 million per mile for comparable new construction in the 2020s, with certain urban and mountainous routes exceeding $15 million per mile. A utility whose transmission system was built at the 1990s cost base, currently carried at a small fraction of its 1990s cost due to accumulated depreciation, is sitting on infrastructure whose replacement cost is 3 to 6 times what the most recent construction would have cost — which is itself already 3 to 4 times the historical book cost.
This is the core of the accounting gap: a transmission line does not become less physically valuable because an accountant has depreciated its book value. The wires are in the ground. The towers are in the fields. The right-of-way easement — which is the most valuable and irreplaceable component of the entire transmission system — was secured decades ago and would be extraordinarily difficult or impossible to replicate today. The accountant records zero. The owner’s replacement cost is in the hundreds of millions or billions of dollars.
PART III: THE OWNER’S VALUATION — REPLACEMENT COST AND THE PERPETUAL WATER RIGHT
What a Business Owner Would Pay for an Electric Utility Today
A sophisticated utility acquirer does not build a DCF model and apply an earnings multiple. They count the kilowatts of capacity, the miles of transmission and distribution lines, the number of substations, the rating of each major transformer bank, and the permitted capacity of each generating station. They then estimate the cost of replicating that system from scratch in today’s regulatory and construction environment. That replacement cost estimate is the economic floor on the asset’s value — the value of having already built what would be extraordinarily difficult and expensive for any competitor to replicate.
The owner then adjusts this replacement cost estimate downward for two factors: the remaining useful life of the existing assets (which reduces the time until replacement capital must be spent) and the regulatory environment (which determines how quickly new capital spending can be recovered through rates). Against this replacement cost floor, the owner compares the current EV/Rate Base multiple being demanded by the seller.
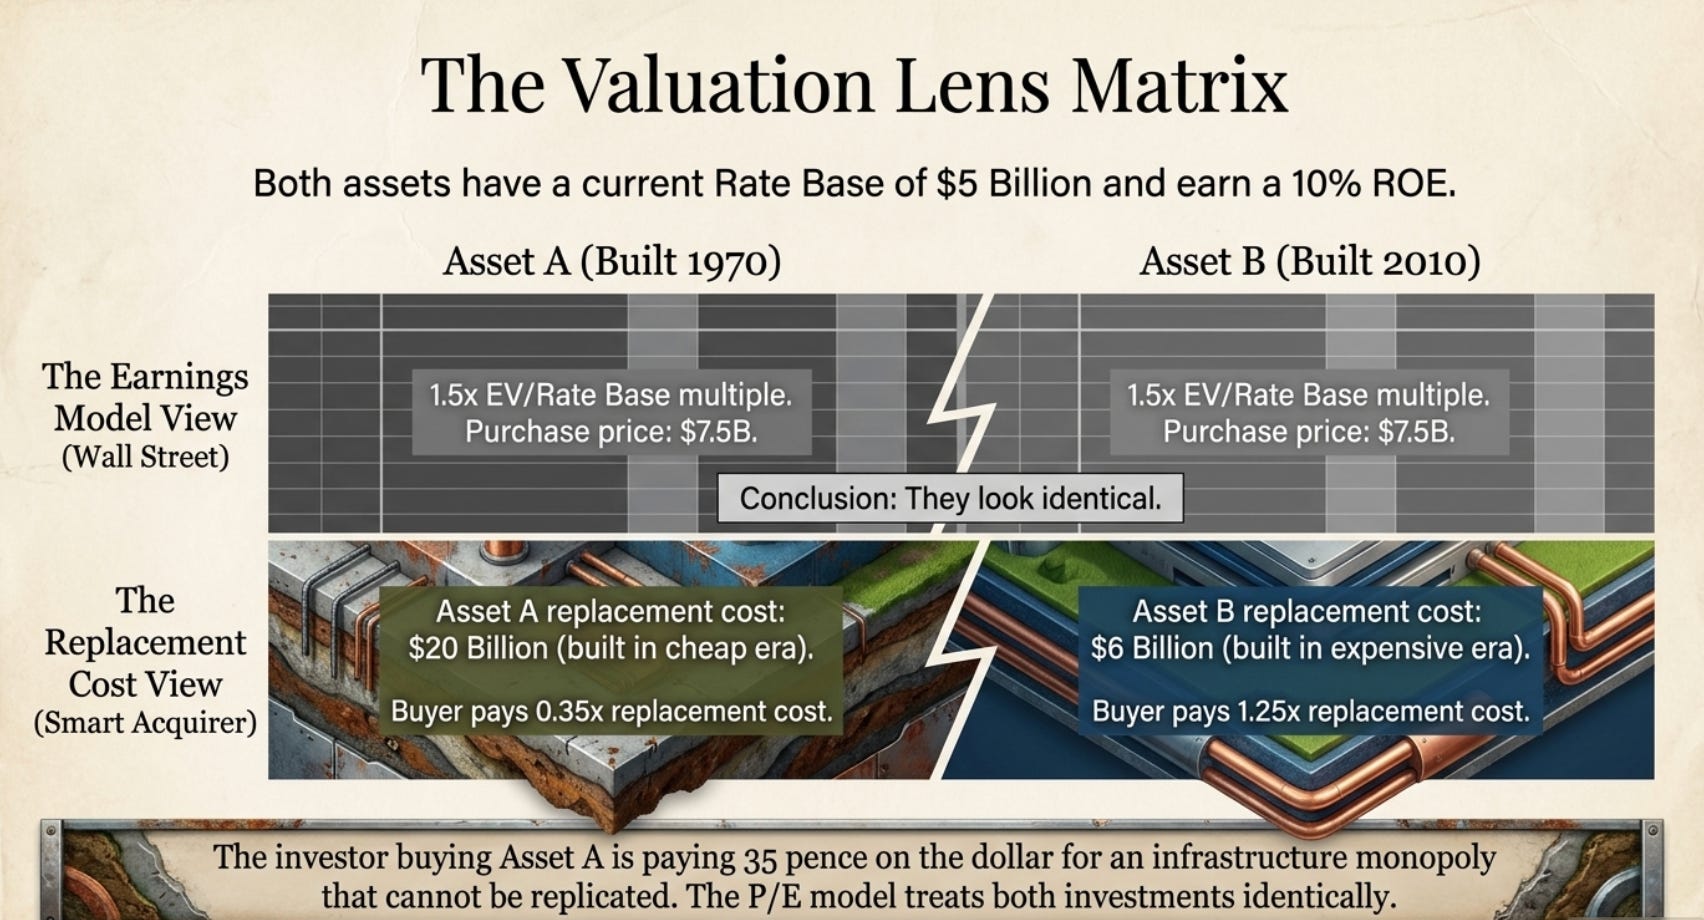
In US utility M&A, recent transactions have priced at approximately 1.3 to 1.7 times rate base. But rate base, as explained above, is substantially below replacement cost for most mature utility systems. If a utility’s transmission and distribution system has a rate base of $5 billion — reflecting 50 years of historical cost accumulation minus depreciation — but its replacement cost is $20 billion (because the assets were originally built at 1970s costs and would cost 4 times as much to rebuild today), then a purchase price of $7 billion (1.4x rate base) is actually only 0.35x replacement cost. The buyer is paying 35 cents for every dollar of infrastructure value that cannot be replicated by any competitor on any timeline.
This is the gap the owner sees that the earnings model does not. The earnings model takes the current rate base, applies the allowed return on equity, generates a current earnings figure, and applies a multiple. The replacement cost analysis asks a more fundamental question: what would it cost to build this system today, and what am I paying relative to that cost?
The Hydroelectric Case: Where the Gap Becomes a Chasm
The most extreme version of the replacement cost gap exists in hydroelectric generation, and Brookfield Renewable Partners provides the most documented and publicly disclosed example of this dynamic in the global markets.
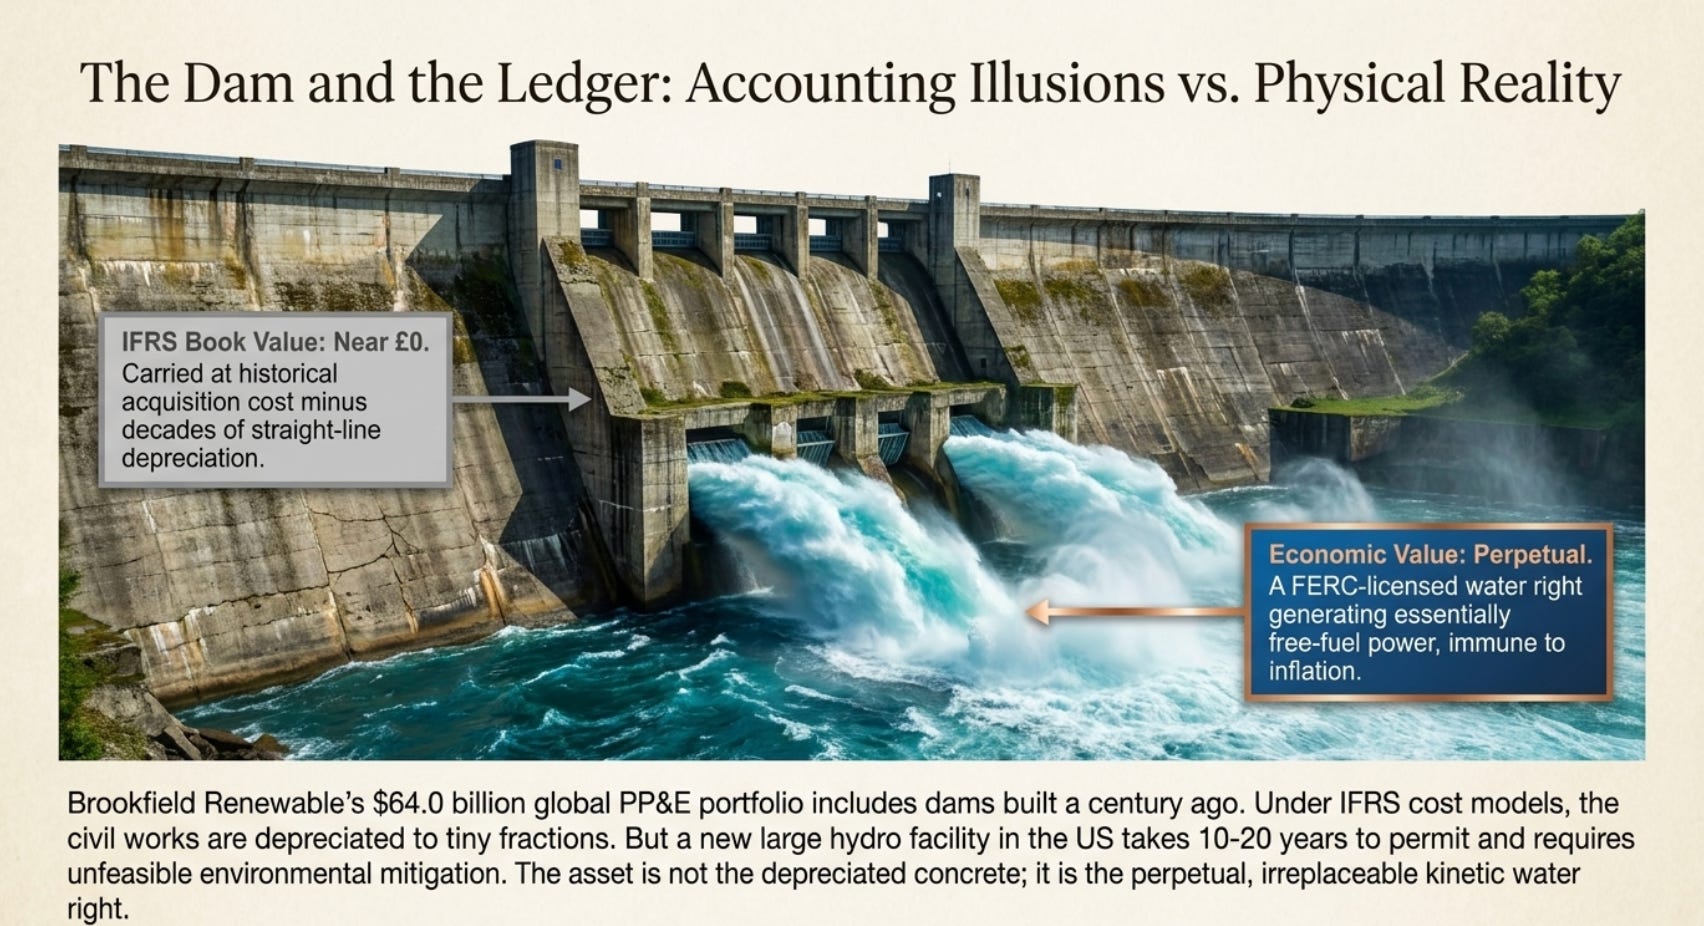
Brookfield Renewable operates what it describes on its own website as “perpetual assets” — hydroelectric generating stations built primarily in the 1920s through 1950s, on rivers in the northeastern United States, Canada, Brazil, Colombia, and Europe. These stations produce electricity by capturing the kinetic energy of falling water, using turbines and generators that, while requiring periodic maintenance and occasional major refurbishment, have no fuel cost. The water flows from the mountains to the sea whether or not you capture its energy. The hydroelectric station’s job is simply to be in the path of that flow and to convert it into electricity. The Brookfield 2023 Annual Report describes PP&E totalling $64.0 billion across its entire renewable energy platform — but the carrying values of the oldest hydro assets, built a century ago, have been depreciated to tiny fractions of their original construction costs.
What would it cost to build these assets today? The answer is approximately never, at any price. In the northeastern United States, permitting a new large conventional hydroelectric dam requires navigating the Federal Energy Regulatory Commission’s (FERC) hydroelectric licensing process, environmental review under the National Environmental Policy Act, state environmental permits, consultations with tribal nations, fish passage requirements, and litigation from environmental groups and downstream water users. The timeline from initial application to operating license for a new major hydro facility in the US is typically 10 to 20 years. The environmental mitigation costs — fish passage facilities, minimum flow requirements, sediment management — are enormous and were not incurred by the 1920s and 1930s builders who simply received a permit from a then-compliant federal government and built their dam. The replacement cost of a new large hydro facility is therefore not merely the civil construction cost. It is the civil construction cost plus two decades of permitting plus tens of millions of dollars in environmental mitigation plus the opportunity cost of the capital during the waiting period.
Brookfield explicitly acknowledges this. The company’s investor materials consistently describe the hydroelectric portfolio as worth substantially more than its depreciated book value, and note that the assets are “irreplaceable” in the context of their licensed water rights and physical locations. This is not marketing language — it is an accurate description of the regulatory and physical reality. A water right that has been in continuous productive use since 1927 cannot be replicated by a competitor regardless of capital budget. The right itself, codified in a FERC hydroelectric licence that is renewed every 30 to 50 years, is an intangible asset that appears nowhere on the balance sheet at fair value. The civil works — the dam, the powerhouse, the penstocks — are depreciated to near-zero. The licensed water right, which is the reason the civil works were built there in the first place, is carried at whatever nominal cost was incurred in obtaining the original permit a century ago.
The owner who looks at this situation sees three layers of value that the balance sheet does not capture. First, the physical civil works at replacement cost — dams and powerhouses that would cost billions to build new and cannot be permitted for new construction in most US locations. Second, the licensed water right — a perpetual entitlement to capture a specified flow of water for power generation, renewed by FERC subject to environmental conditions, with no expiration and no competition from any other developer who could obtain a new licence for the same site. Third, the operational learning — a century of operational knowledge about the specific hydrology of each site, the optimal turbine settings for different flow conditions, the maintenance intervals for each specific piece of equipment in each specific environment. None of these three layers of value appears on the balance sheet at anything close to its economic reality.
PART IV: THE WALL STREET PROBLEM — WHY EARNINGS MULTIPLES FAIL UTILITIES
The Circularity of Utility Earnings Models
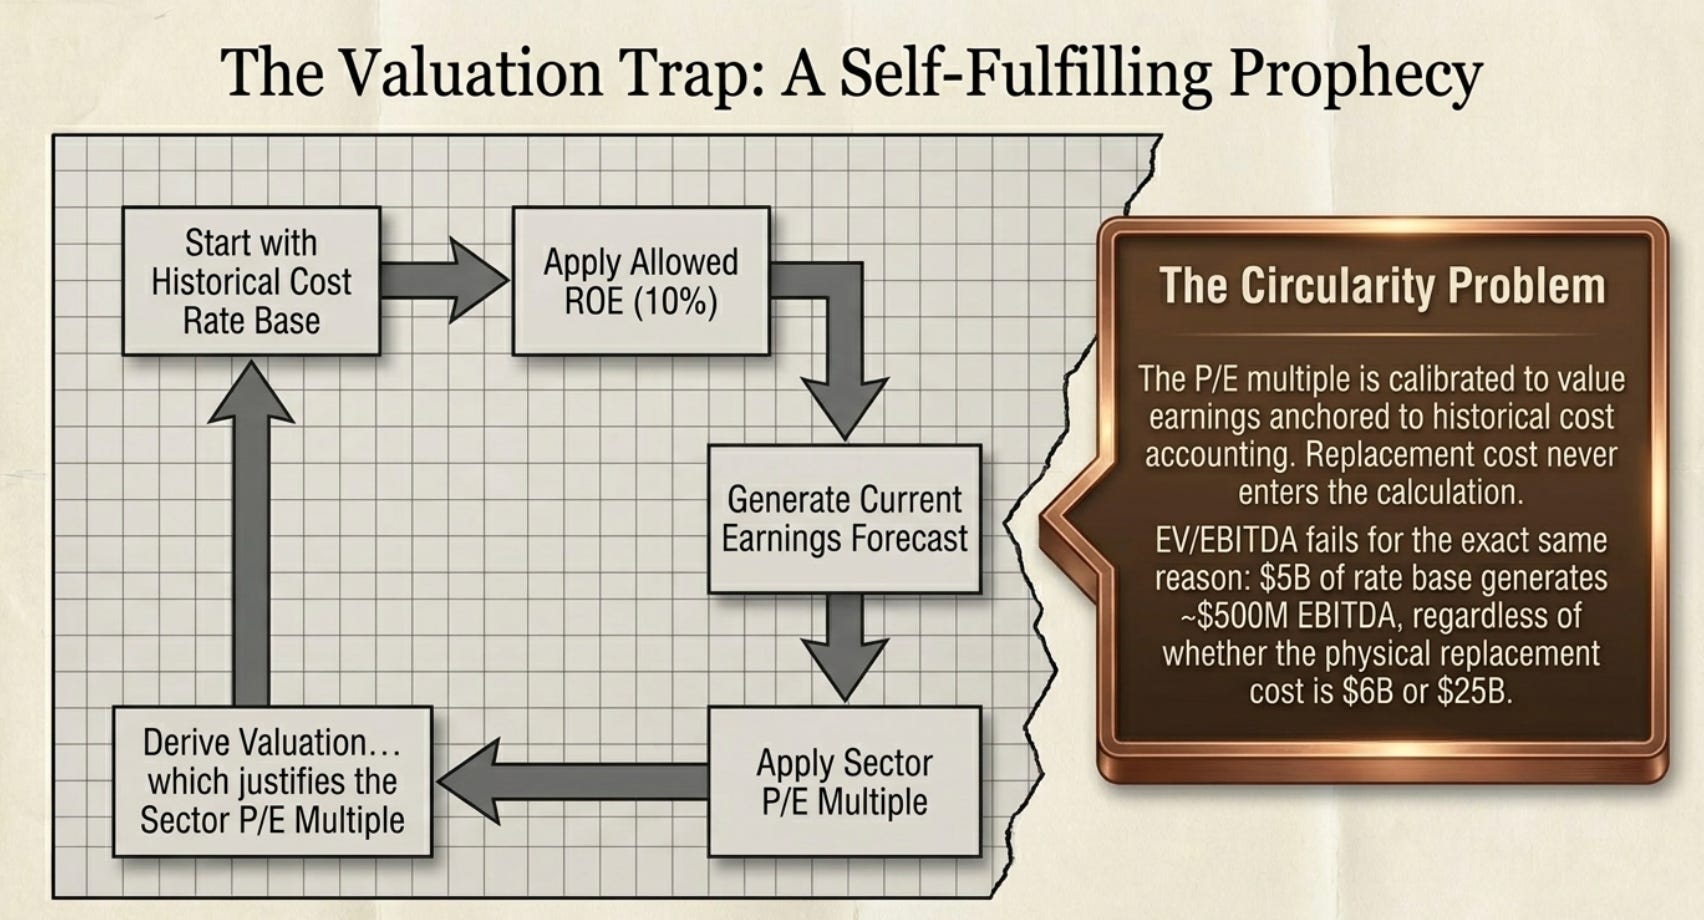
The standard Wall Street approach to valuing a regulated utility begins with the current rate base, applies the allowed return on equity, generates a forecast of utility earnings, and then applies a price-to-earnings or price-to-book multiple derived from comparable utility transactions or sector averages. This approach has a circularity problem that is rarely acknowledged.
The P/E multiple applied in the utility sector is itself derived from the historical relationship between utility share prices and utility earnings. But utility earnings are themselves a function of the rate base — the regulatory allowed return on the historical cost asset base. This means the P/E multiple is calibrated to value a stream of earnings that is anchored to historical cost accounting. It is perfectly circular: it tells you what earnings are worth in a market where everyone is using the same earnings — which are based on the same historical cost accounting — to set prices. It cannot tell you whether the underlying physical assets are cheap or expensive relative to their replacement cost, because replacement cost never enters the calculation at any point.
The practical consequence is that a utility whose assets were built at 1970s costs, currently earning its 10% allowed return on a rate base that is 20% of replacement cost, looks identical in the P/E framework to a utility whose assets were built in 2010 at near-current costs, earning the same 10% return on a rate base that is 85% of replacement cost. Both earn approximately the same return on their respective rate bases. Both will trade at approximately the same P/E multiple. But the first utility’s physical infrastructure is worth 5 times the rate base in replacement cost terms, while the second utility’s is worth only 1.2 times. The investor who bought the first utility at 1.5x rate base (which equals 0.3x replacement cost) and the investor who bought the second at 1.5x rate base (which equals 1.28x replacement cost) paid completely different prices for completely different assets — and the P/E model treats them identically.
The EV/EBITDA framework fails for a related reason: EBITDA for a regulated utility is determined by the rate base and the allowed return, not by the competitive position of the underlying assets. A utility with $5 billion of rate base earning 10% ROE generates approximately $500 million in operating income before depreciation — regardless of whether the $5 billion rate base represents $25 billion of infrastructure at replacement cost (in which case the assets are extremely cheap) or $6 billion of replacement cost infrastructure (in which case they are fairly priced). EBITDA flattens the distinction. Only the replacement cost analysis preserves it.
PART V: STORIES FROM THE GRID — THREE CASE STUDIES IN UTILITY VALUE ARBITRAGE
The Aging American Grid: When Deferred Depreciation Becomes Someone Else’s Windfall
The story of American electric transmission infrastructure since the energy deregulation wave of the 1990s is, in one sense, a story of extraordinary value accumulation that was invisible to the investors who owned it. During the 1990s and early 2000s, the prevailing consensus in the US utility sector was that electricity deregulation would restructure the industry into competitive retail markets, competitive generation, and regulated wires. Merchant power companies would compete for generation business on price. Transmission and distribution would remain regulated. The “wires” business — transmission and distribution alone, without generation — was considered boring, slow-growing, and unsuitable for investors who wanted growth.
Large industrial companies and foreign utilities — National Grid (UK), E.ON (Germany), Scottish Power — accumulated US transmission and distribution assets at prices reflecting this consensus. They bought aging New England and mid-Atlantic utility systems that had been built primarily in the 1950s through 1970s, at book values reflecting the historical construction costs of those decades, at a time when the regulatory framework was uncertain and the assumed trajectory was toward more competition, not more regulation.
What they were actually acquiring — though few framed it this way at the time — was physical infrastructure with replacement costs that were 5 to 10 times the carrying values on the balance sheet, in service territories where the regulatory framework (despite the deregulation rhetoric) continued to guarantee recovery of all prudently incurred costs and an adequate return on invested capital. The right-of-way corridors, in particular, were irreplaceable: a transmission corridor through densely developed New England suburbs that had been secured in the 1950s under much simpler permitting requirements could not be replicated at any cost in the 2000s, because the communities along its route had long since developed around and above the existing corridor and would resist any attempt to establish a new one.
National Grid’s acquisition of New England Electric System in 2000 for approximately $3.2 billion is illustrative. The combined New England transmission and distribution infrastructure — serving Massachusetts, Rhode Island, and New Hampshire — had a net book value at the time that reflected 40 to 50 years of accumulated depreciation on assets originally built at 1950s and 1960s costs. An owner building a replacement cost model would have arrived at a very different number — the replacement cost of the same wires, substations, and rights-of-way using 2000-era construction costs and regulatory requirements. That gap, invisible in the price-to-book framework used in the utility sector at the time, represented extraordinary durable value for a buyer with a long investment horizon.
Brookfield and the Hundred-Year Hydroelectric Dam: When Accounting Age Meets Perpetual Physical Value
In 1999, Brookfield Asset Management began systematically acquiring North American hydroelectric generating stations that had been divested by vertically integrated utilities during the deregulation wave. Many of these facilities had been built between 1900 and 1950 — some were approaching or exceeding 80 years of age. Their book values, after decades of straight-line depreciation, ranged from modest to zero. Their FERC licences, while requiring periodic renewal and environmental compliance, were perpetual in the sense that the water flow they captured was perpetual. The rivers would not stop flowing.
The Brookfield thesis was not expressed in earnings multiples or EBITDA valuations at the time. It was expressed in physics and in hydrology. A cubic meter per second of water falling 100 meters generates a calculable number of kilowatt-hours of electricity. The facility that captures that energy earns revenue at the prevailing electricity price for however long the water flows, which is essentially forever. The operating cost of a fully depreciated hydroelectric facility — primarily maintenance, staffing, and transmission access charges — is a small fraction of the revenue. The capital cost of the facility has been paid once, depreciated once, and does not need to be incurred again unless the civil works physically fail, which properly maintained hydroelectric dams almost never do within a human-relevant time horizon.
The owner’s calculation for a 1930s-vintage hydroelectric facility is straightforward. Take the generating capacity in megawatts. Multiply by the capacity factor (the fraction of time the facility actually generates) to get annual megawatt-hours. Apply the prevailing power purchase agreement price or merchant electricity price per MWh. Subtract operating costs. The result is the annual operating income from a facility that cost nothing to build (in the sense that the capital has been fully depreciated) and that no competitor can replicate. The replacement cost of an equivalent greenfield hydroelectric facility in the same location, today, is the relevant floor on value — and that replacement cost, as established earlier, is functionally incalculable for most US hydro sites given the permitting environment.
Brookfield’s 2023 Annual Report disclosed that PP&E totalled $64.0 billion, reflecting cumulative acquisition and development capital invested across the global portfolio. Crucially, Brookfield reports its hydroelectric assets under IFRS, which allows but does not require the revaluation of PP&E to fair value under the IAS 16 revaluation model. Brookfield elects the cost model, meaning its hydro assets are carried at historical acquisition cost minus depreciation — not at replacement cost or fair value. The company explicitly notes in its investor materials that the hydroelectric portfolio is the most valuable and irreplaceable component of its asset base, generating long-duration, essentially free-fuel power from licensed water rights that no new entrant can obtain.
When Brookfield sells portions of its hydro portfolio — as it did with a 78% interest in a 378 MW US hydroelectric portfolio in Q1 2023 — the transaction prices reveal the gap between IFRS carrying values and market clearing prices. These sales, consistently transacted at prices well above IFRS book values, provide the most direct evidence of the replacement cost premium embedded in assets that the accounting system has been systematically writing down toward zero for 70 years.
The First Energy Transmission Sale: What $4.85 Billion for Old Wires Revealed
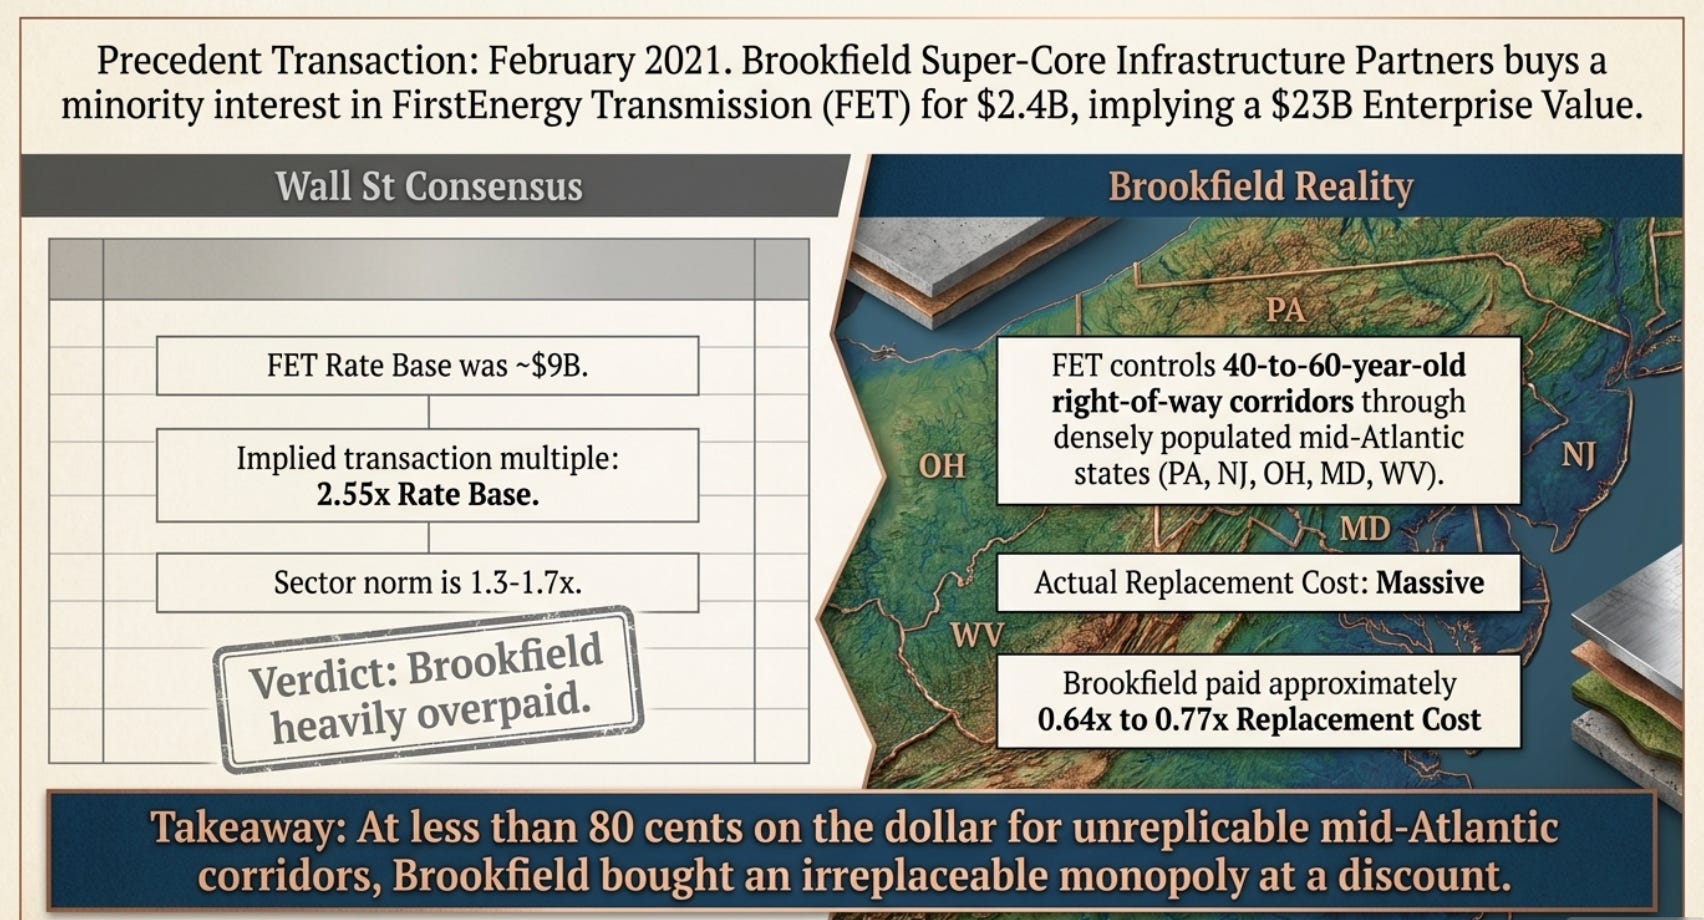
In February 2021, FirstEnergy Corp announced the sale of a minority interest in FirstEnergy Transmission LLC (FET) to Brookfield Super-Core Infrastructure Partners for approximately $2.4 billion, implying a total enterprise value for FET of approximately $23 billion for a set of transmission assets serving West Virginia, Pennsylvania, New Jersey, Ohio, and Maryland.
The FET transmission system, built primarily between the 1960s and 1990s, had a rate base at the time of the transaction of approximately $9 billion. Brookfield paid for a minority interest at a price implying approximately 2.55x rate base for the total transmission enterprise. A standard utility sector model — which applies 1.3 to 1.7x rate base as a normalised transaction range — would have said Brookfield overpaid. But Brookfield was not applying the standard earnings model to the standard rate base.
Brookfield was applying the replacement cost framework to a transmission system whose right-of-way corridors through the densely populated mid-Atlantic region were assembled over 40 to 60 years, under environmental and land acquisition conditions that no longer exist. The cost of replicating those corridors today — even if money were unlimited — would be measured not in billions but in decades of litigation, environmental review, and community opposition. The existing corridors are the irreplaceable asset. The wires and towers strung on those corridors are replaceable. The right to put wires on those corridors in perpetuity, through suburban Pennsylvania and rural West Virginia, is not.
At 2.55x rate base and a rate base that is perhaps 25% to 30% of actual replacement cost for a 1970s-era transmission system in the mid-Atlantic, Brookfield paid approximately 0.64x to 0.77x replacement cost for an irreplaceable infrastructure monopoly — below replacement cost, for infrastructure that no competitor can replicate. The earnings model said 2.55x rate base looks expensive relative to the 1.5x sector norm. The replacement cost model said 0.64x to 0.77x replacement cost looks reasonable for a monopoly asset in a high-regulatory-barrier jurisdiction.
The lesson here is precise: the same transaction looks expensive or cheap depending entirely on which measurement framework you apply to it. The earnings model — applying a multiple to a rate-base-derived earnings figure — sees 2.55x and says expensive. The replacement cost model — dividing the purchase price by the estimated cost of reproducing the same infrastructure from scratch today — sees 0.64x to 0.77x and says reasonable. Brookfield, which has built its entire franchise on understanding this distinction, was applying the second framework. The market commentary at the time was largely applying the first.
PART VI: THE THREE-LAYER VALUE FRAMEWORK FOR REGULATED UTILITIES
How an Owner Actually Measures What They Are Buying
Acquiring a regulated electric utility is not primarily a financial exercise. It is primarily an engineering exercise followed by a regulatory exercise, with the financial analysis in third place. The owner’s framework operates in three distinct layers, each of which captures a different component of value that the earnings model ignores entirely.
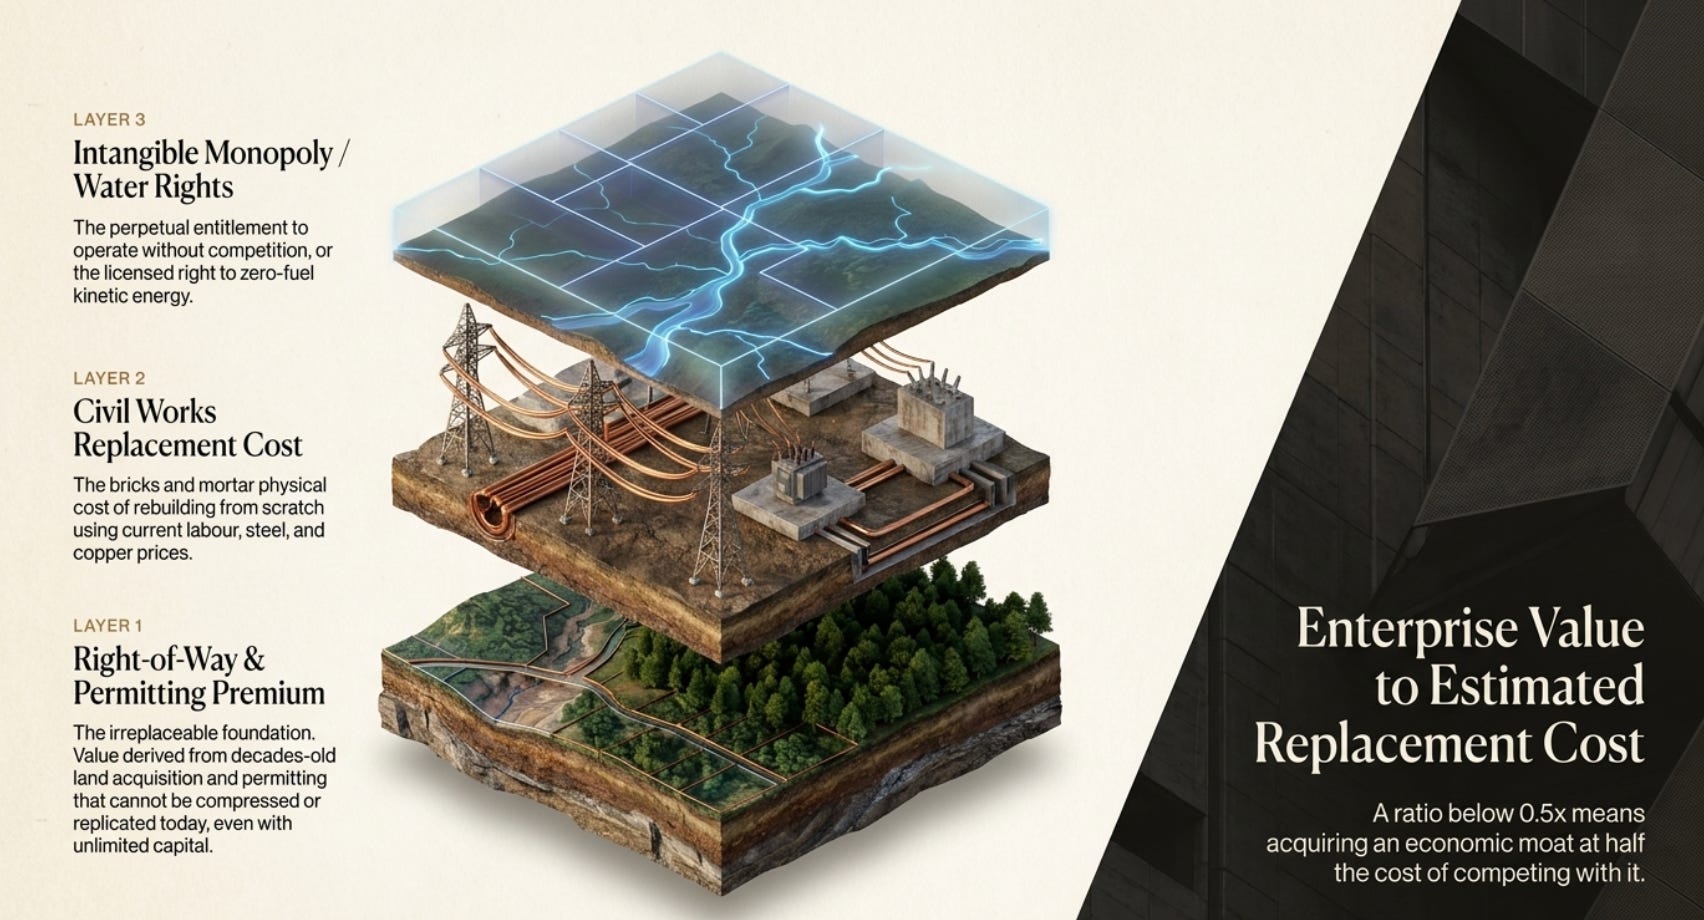
Layer one: the civil works replacement cost. This is the cost of building the generation, transmission, and distribution infrastructure from scratch, using current labour, materials, and equipment costs, but excluding the permitting process. It is the “bricks and mortar” replacement cost — the steel in the towers, the copper in the cables, the concrete in the dam. This layer is calculable from engineering cost databases, recent comparable construction projects, and utility capital expenditure disclosures. It is consistently well above the GAAP book value for infrastructure built more than 15 to 20 years ago, because construction costs have risen dramatically and the accounting has been depleting the old cost basis.
Layer two: the right-of-way and permitting premium. This is the value of having already secured the permits, rights-of-way, and regulatory approvals that allow the infrastructure to exist in its current location. For a transmission corridor through a densely populated suburban area, this layer may be the largest of the three — the physical cost of building a new transmission line may be $3 million per mile, but the right-of-way acquisition cost, permitting timeline, litigation exposure, and environmental compliance for a hypothetical new parallel corridor may add another $5 to $15 million per mile in implicit cost. This layer is what makes the existing infrastructure truly irreplaceable: even unlimited capital cannot compress the 10 to 20 year permitting timeline for major new transmission infrastructure. This layer does not appear on any balance sheet. It is the accumulated benefit of decisions made by utility engineers and regulators decades ago that could not be replicated today at any price in any reasonable timeframe.
Layer three: the licensed water right for hydroelectric assets. This is the most extreme version of the unrecognised value, and it applies specifically to regulated hydroelectric generating stations. A hydroelectric licence is not a depreciating asset. The water flows whether or not it is captured. The licensed right to capture it — granted by FERC for 30 to 50 year terms and historically renewed subject to environmental conditions — is a perpetual entitlement to a fuel source that has zero ongoing cost. A 100 MW hydroelectric facility with a 40% capacity factor produces approximately 350,000 MWh per year, which at $60/MWh generates $21 million per year in revenue — perpetually, with no fuel cost. The FERC licence that enables this revenue stream is the asset. The civil works that harness it are the tool. Both are irreplaceable. Neither is fully reflected on any balance sheet.
The practical metric that synthesises these three layers is the ratio of Enterprise Value to Estimated Replacement Cost — what the buyer is paying relative to what it would cost a competitor to reproduce the same infrastructure system. For mature, fully depreciated utility systems, this ratio is frequently below 0.5x, meaning buyers are paying less than half the cost of reproduction. For more recently built systems, the ratio approaches or exceeds 1.0x.
An owner applying this framework to a portfolio of 1960s-era electric distribution assets in a dense urban market might calculate: civil works replacement cost at $X per mile of cable times total cable miles, plus right-of-way premium based on current land and permitting costs in the service territory, plus the value of existing customer relationships and utility franchise rights. Compare the total to the acquisition price. If the acquisition price is below 0.6x of this total, the owner is acquiring physical infrastructure monopoly at below replacement cost — which, in a market where no new competition is possible, means they are acquiring an economic moat at a discount to the cost of competing with it.
PART VII: CONFIRMED CATALYSTS — WHAT IS ALREADY ACCELERATING
Catalyst 1: The AI and Data Centre Load — Already Contracted, Not Forecasted
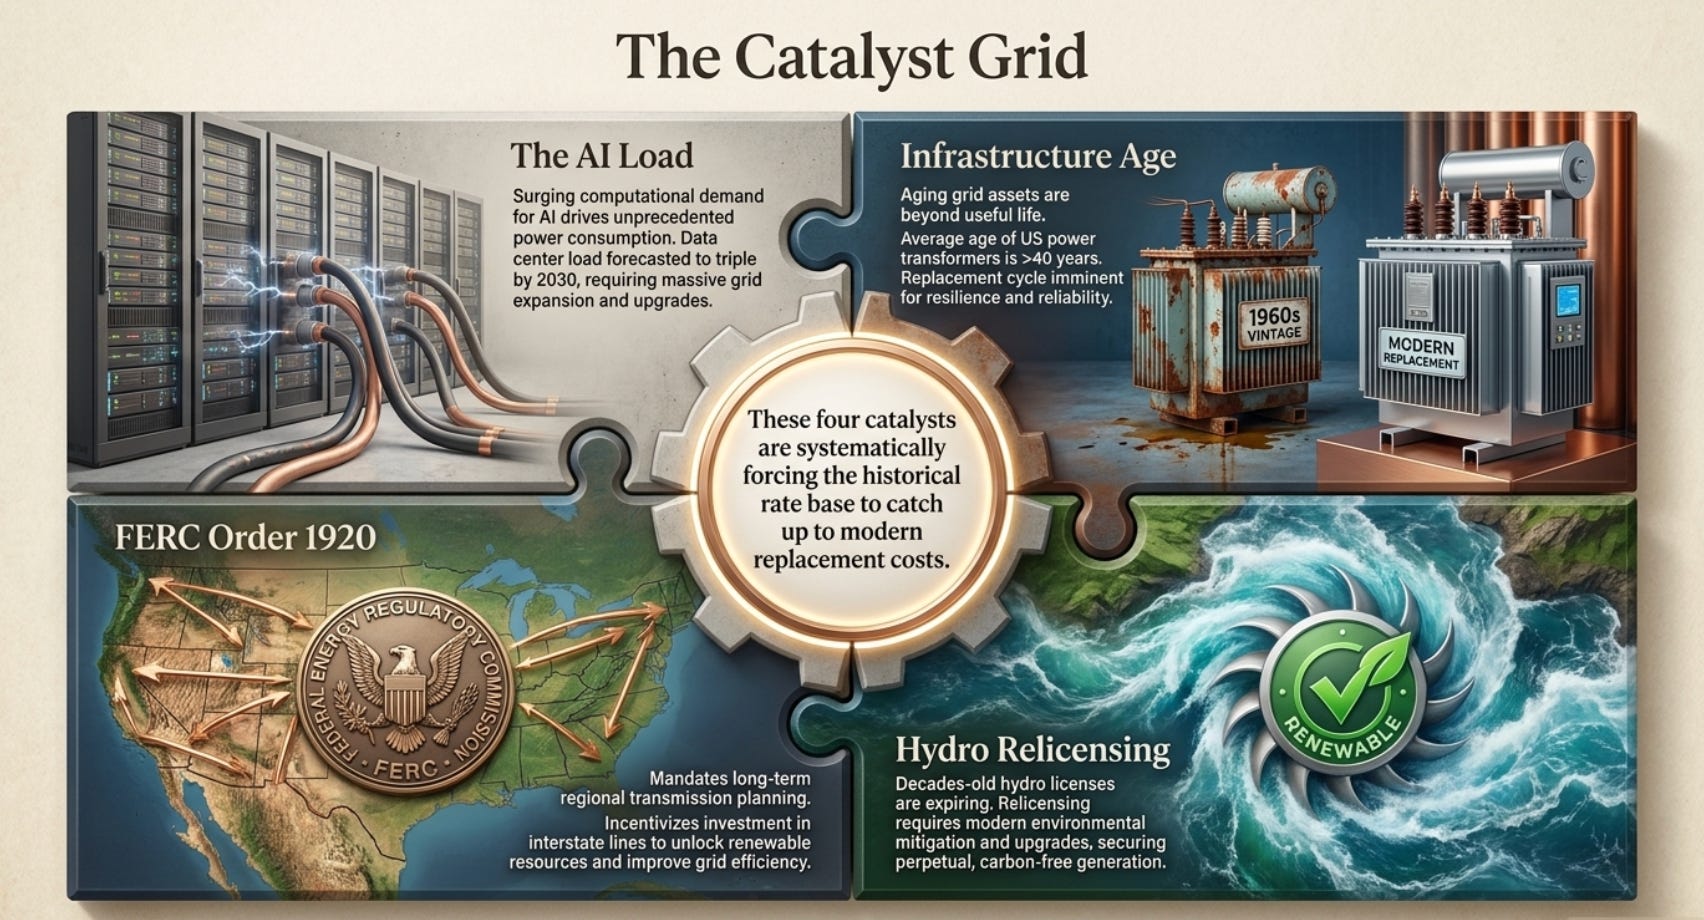
The most significant structural change in the US electric utility industry in a generation is happening right now, driven by the construction of artificial intelligence data centres and the hyperscalers’ insatiable demand for reliable, large-scale electricity. Microsoft, Google, Amazon, and Meta are collectively committing to build data centre campuses requiring hundreds to thousands of megawatts of power at individual sites, signed under long-term power purchase agreements directly with utilities, typically for 10 to 20 year terms.
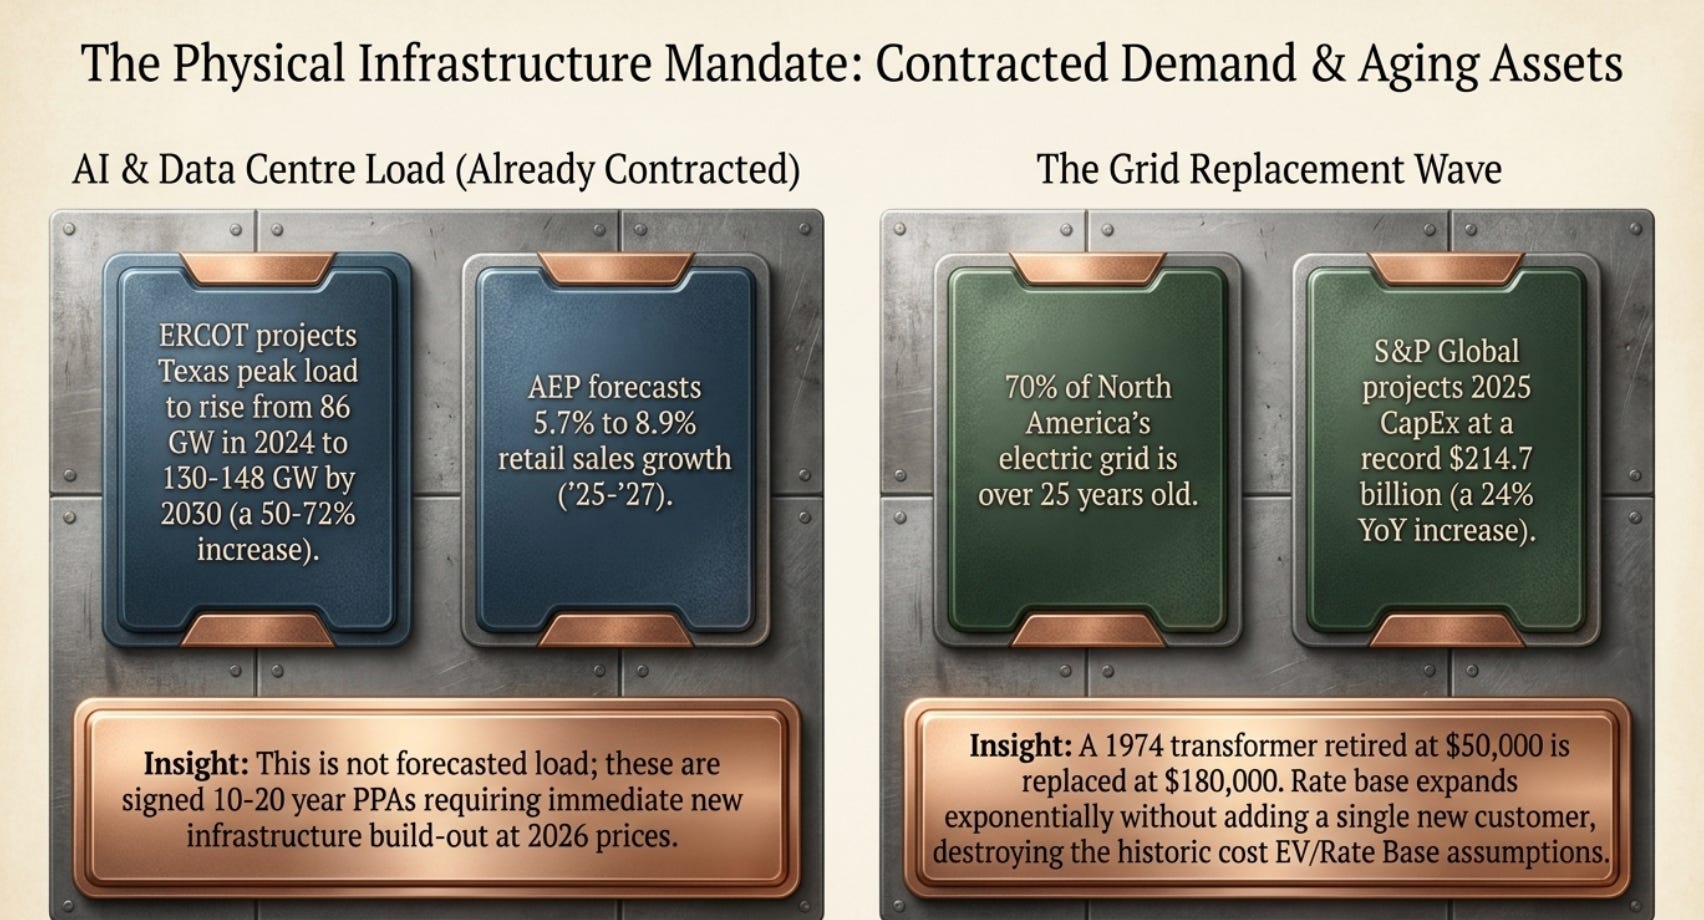
The Gabelli utility research report, published in October 2025, noted that AEP forecasts 2025 to 2027 retail sales growth of 5.7%, 8.4%, and 8.9% respectively, driven heavily by commercial and industrial data centre load. NiSource expects to add new dispatchable generation to serve data centre customers who have committed to the utility’s service territory through 2032. ERCOT projects Texas peak load to rise from 86 GW in 2024 to 130 to 148 GW by 2030 — a 50 to 72% increase in six years.
This load growth is not a forecast that might or might not materialise. It is committed by customers who have signed power purchase agreements and are building data centres in the utility’s service territory right now. The utilities are required to serve these customers and are building generation and transmission infrastructure to do so, all of which flows into the rate base — at current construction costs, which are dramatically higher than the costs at which the existing system was built. Each dollar of new capital investment adds to the rate base at current cost levels, systematically expanding the rate base and widening the gap between rate base and the historical cost book value of the older portion of the system.
For the owner’s replacement cost framework: data centre load growth means the existing transmission and distribution infrastructure — which was sized for the historical load pattern — is now being supplemented with new capacity that will be built at current costs. The old infrastructure serving the existing load becomes, in effect, even more valuable relative to its book value, because the incremental load it serves is growing and the replacement cost of the entire expanded system is growing faster than the rate base as old assets are replaced at current prices.
Catalyst 2: Grid Modernisation and Infrastructure Age — The Replacement Wave Is Already Funded
As noted by the Department of Energy and confirmed by the Edison Electric Institute, approximately 70% of North America’s electric grid infrastructure is more than 25 years old. The US electricity system — which was built primarily from the 1950s through the 1990s — is entering its replacement cycle, and that replacement is happening at current construction cost levels that are 3 to 5 times the original cost levels of the assets being retired.
In 2024, EEI member utilities invested $186.4 billion in capital expenditure — the twelfth consecutive record year. S&P Global projects 2025 capital expenditure at $214.7 billion across tracked utilities, a 24% increase in a single year. These are not aspirational numbers. They are actual capital budgets approved by utility boards, filed with state regulators in rate cases, and in many states pre-approved for recovery through forward-looking rate mechanisms that eliminate regulatory lag.
Each year of record capital expenditure at current cost levels is simultaneously two things: it is visible in the capital expenditure line of the utility’s financial statements, and it is invisible in the impact it will have on future rate base relative to the old historical cost assets being retired. When a utility retires a transformer that was installed in 1974 at $50,000 and replaces it with a new transformer at $180,000, the rate base increases by $130,000 for that single asset, and the rate base effect of every such replacement across thousands of similar assets accumulates systematically over a decade of infrastructure replacement. The EV/Rate Base multiple paid in 2026 for a utility’s current rate base will look inexpensive relative to what that rate base will be in 2035 after a decade of replacement at current construction costs.
Catalyst 3: Transmission Permitting Reform — Already Enacted Under FERC Order 1920
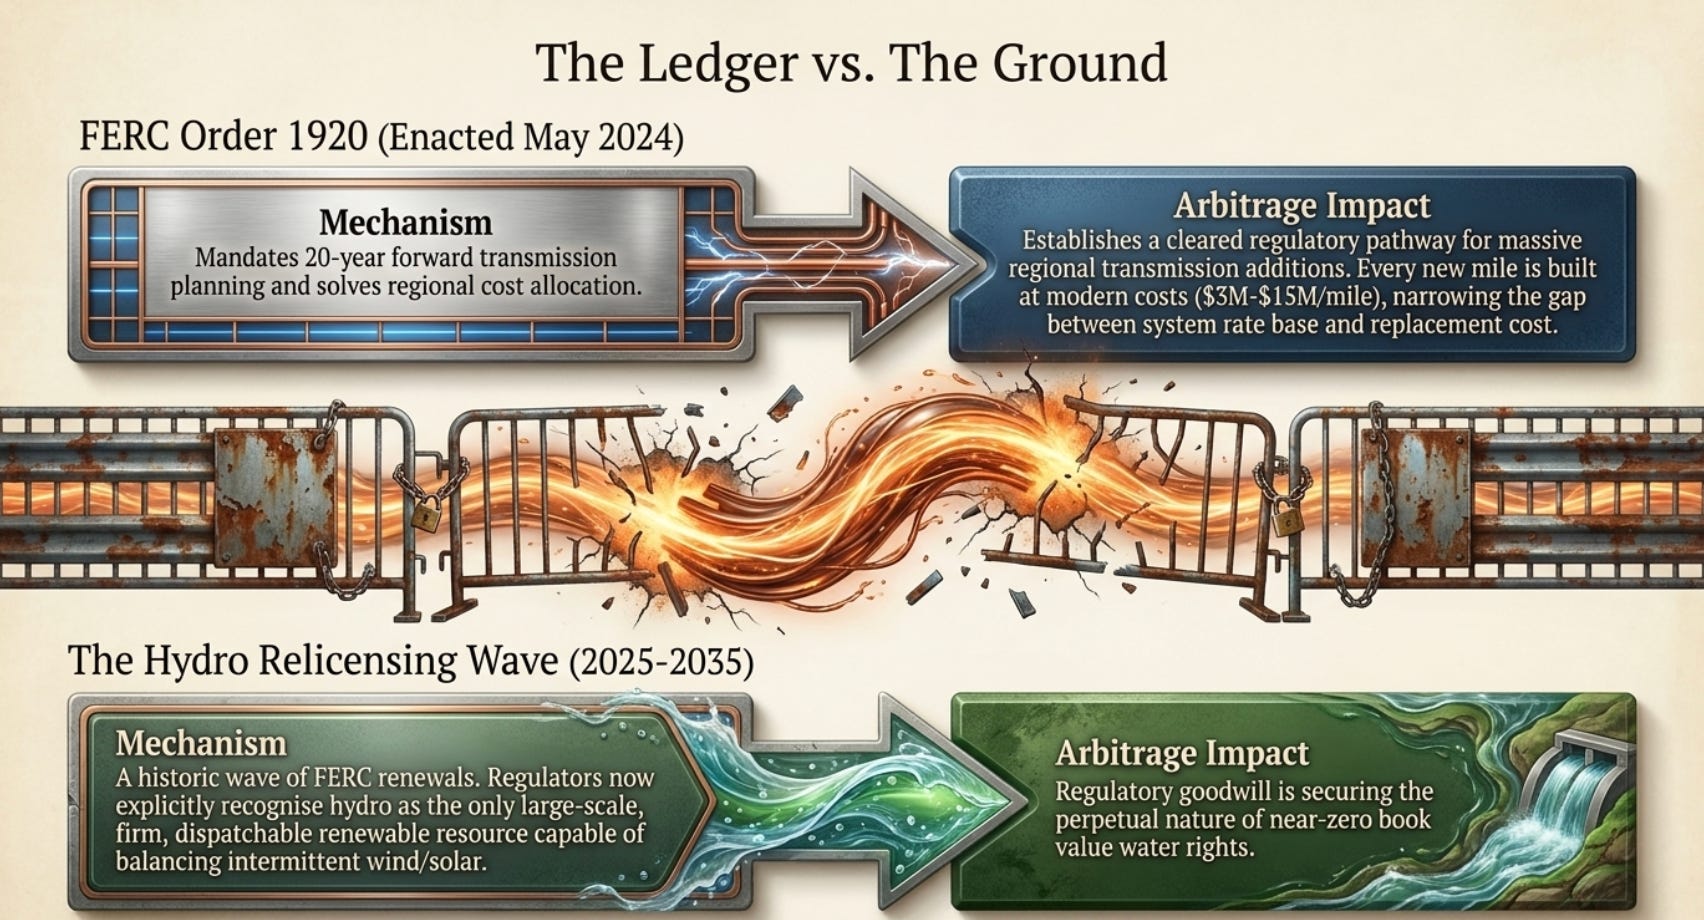
The Federal Energy Regulatory Commission’s Order 1920, issued in May 2024, represents the most significant reform to US transmission planning in decades. The order requires transmission planning on a longer geographic horizon (20 years forward rather than 10), mandates cost allocation for regional transmission projects that serve multiple beneficiaries, and creates a framework for scenario-based planning that explicitly accounts for the load growth from electrification and data centres.
The practical consequence is that FERC has now established a regulatory pathway for large regional transmission projects that will add substantially to the rate bases of transmission-owning utilities over the next decade. These projects — driven by the need to integrate renewable generation and serve new large loads — were previously delayed or blocked by the absence of a coherent cost allocation framework. With Order 1920, the pathway from project identification to regulatory approval to construction to rate base addition is clearer than it has been at any point in the past 30 years.
For the replacement cost analysis: Order 1920 creates mandated new transmission investment at current construction costs. Every mile of new transmission built under the Order 1920 framework adds to the rate base at 2026 to 2035 construction costs — costs that are 3 to 5 times the historical costs of the existing transmission infrastructure. The gap between rate base and replacement cost for the combined system will narrow as new investment at current costs replaces old investment at historical costs — but in the near term, the existing old infrastructure continues to deliver its economic function at a book value that is a fraction of what a new entrant would pay.
Catalyst 4: The Hydroelectric Relicensing Wave and FERC’s Renewable Preference
Between 2025 and 2035, a significant number of existing FERC hydroelectric licences are due for renewal. The FERC relicensing process has historically been the moment of greatest risk for hydroelectric operators — environmental conditions attached to renewed licences can add significant cost through fish passage requirements, minimum flow guarantees, and water temperature management. But the energy policy context has shifted dramatically: hydroelectric generation is now the only large-scale renewable resource that provides firm, dispatchable power — power that can be delivered on demand regardless of weather conditions. Wind and solar cannot make this claim.
The growing recognition among regulators, grid operators, and policymakers that dispatchable renewable generation is worth more than intermittent renewable generation is creating a policy environment in which hydroelectric facilities are being relicensed with significantly more regulatory goodwill than in previous decades. FERC’s recent relicensing approvals have reflected an explicit acknowledgement that the power system needs firm, dispatchable, renewable generation to balance the variability of wind and solar. This policy shift — already visible in recent FERC relicensing orders — is a confirmed catalyst for the retention and enhancement of hydroelectric asset value that the accounting system carries at near-zero book value.
CONCLUSION: THE INFRASTRUCTURE THAT AGES ON PAPER BUT NOT IN THE GROUND
There is something almost philosophically confusing about the accounting for regulated electric utilities — and that confusion is the source of the value arbitrage described in this paper.
When a mine produces iron ore, it is genuinely depleting an asset. The ore extracted today is ore that cannot be extracted tomorrow. The UOP depletion method, whatever its other limitations, is directionally correct: the asset is being consumed as production continues, and the declining book value reflects a genuine physical reality.
When an electric utility operates a transmission line, nothing is being consumed in the same sense. The right-of-way corridor that was secured in 1968 is still a right-of-way corridor in 2026. The land it traverses has not been depleted. The towers standing on it are not meaningfully worn out if they have been maintained. The accounting depreciates the asset to zero over 40 years because the accounting standard requires a consumption assumption, but the physical asset — and more importantly, the competitive advantage embodied by the right-of-way and the regulatory franchise — does not diminish in proportion to the depreciation charge.
This means that, uniquely among physical asset classes, a fully depreciated electric utility infrastructure system is frequently worth more in replacement cost terms than a recently built one — because the old system was built when costs were lower, secured rights-of-way under more permissive conditions, and operates under regulatory relationships that have been established and stress-tested over decades. The age of the asset, which accounting treats as a reason to reduce its value, is often a reason to increase its competitive value.
An owner who understands this buys regulated utility infrastructure with a long time horizon, applies the replacement cost framework rather than the earnings multiple framework, and earns the returns that accrue to anyone who acquires an irreplaceable monopoly infrastructure asset at below its cost of replication. The grid will be rebuilt. It will be rebuilt at current costs. The owner of the existing rights-of-way, the existing regulatory franchises, and the existing licensed water rights will be the direct beneficiary of every dollar that higher replacement costs add to the replacement cost premium above book value.
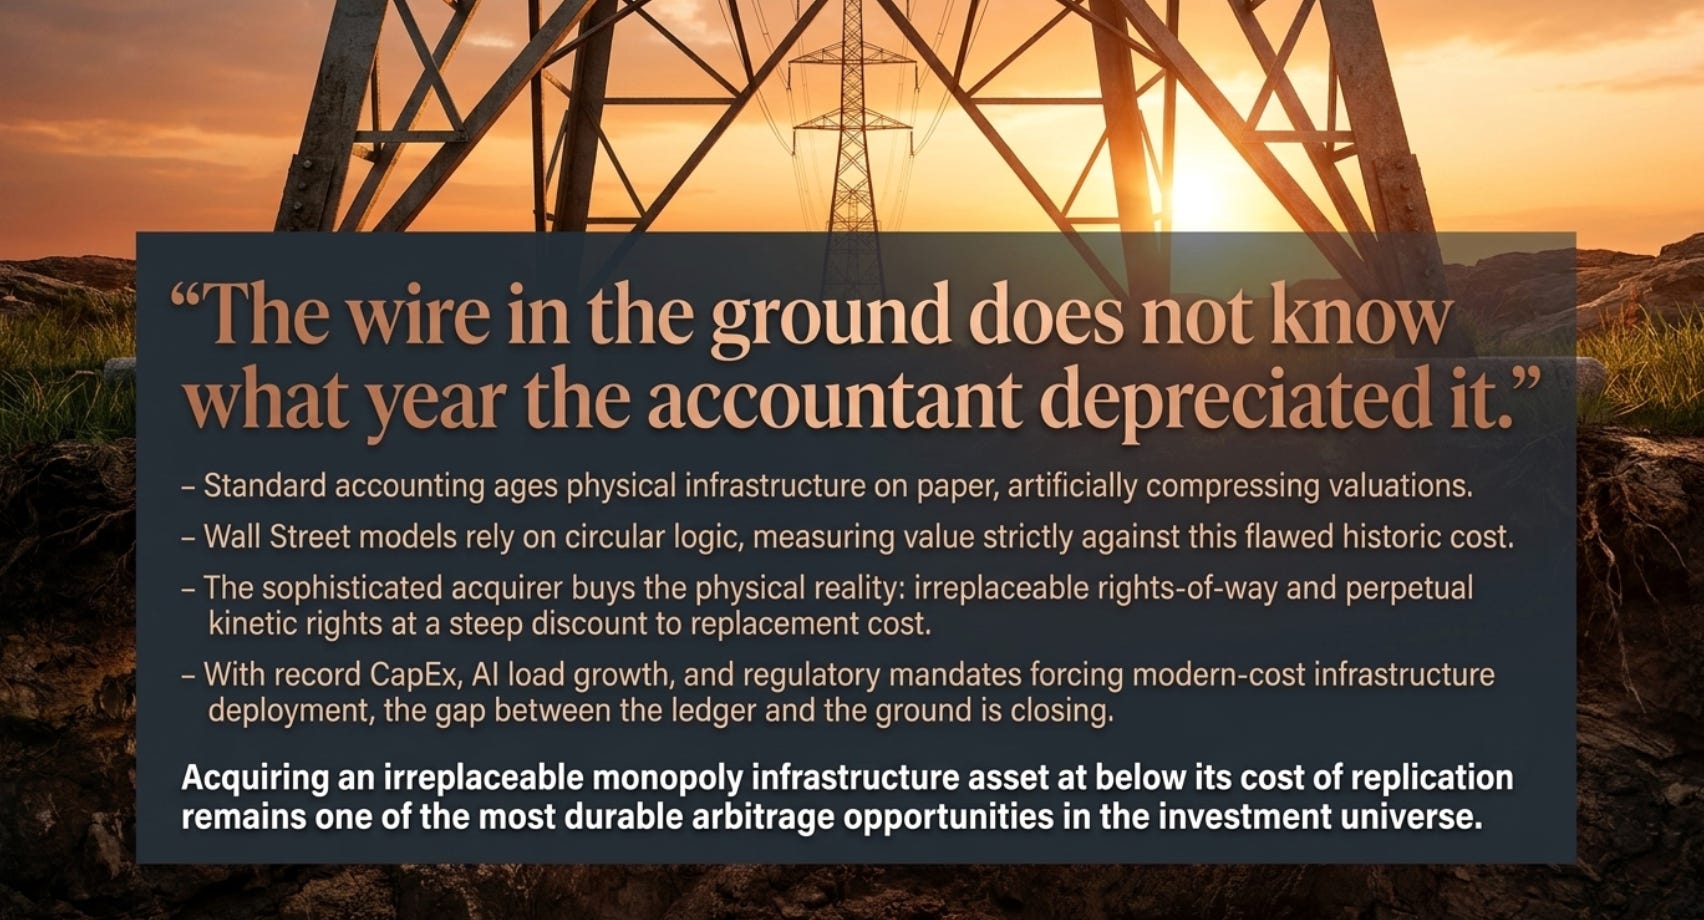
The wire in the ground does not know what year the accountant depreciated it. It carries current with the same indifference it has carried current since the day it was energised. The replacement cost is what it is. And the gap between that replacement cost and the number the accounting system produces is, in the regulated utility sector, often among the largest and most durable such gaps in the entire investment universe.
This white paper is for educational and informational purposes only. Data on utility capital expenditure is drawn from the Edison Electric Institute’s annual financial review and S&P Global Market Intelligence tracking of investor-owned utilities. FERC Order 1920 is publicly available from the Federal Energy Regulatory Commission. FirstEnergy Transmission transaction data is drawn from FirstEnergy Corp’s Form 8-K filed February 2021. Brookfield Renewable data is drawn from the company’s 2023 Annual Report and 20-F filed with the SEC. AES Indiana rate case information is from the Indiana Utility Regulatory Commission’s publicly available case files for Cause No. 45911. Nothing herein constitutes investment advice.
If you like this read, check out my other writings below 👇
Rust, Rigs, and the Recurring Revenue Hidden in Plain Sight: A Deep Dive into Beng Kuang Marine (SGX: BEZ)

The Old Steel and the Sea: Why You Should Care About a Ship Maintenance Company
Investment Reflection #2 — The Grand Play: 100 Years of the World’s Nations as Characters in the Greatest Story Ever Told

“The world is not a chessboard. It is a living organism, where every cell — every nation — eats, competes, cooperates, and occasionally tries to eat the others. Understanding it requires not just memorizing moves, but understanding hunger.”

The Tide Is Going Out: Commodity Houses, Private Credit, and the AI Debt Bomb

Start Here: What This Article Is About
Why I Passed on Graftech (EAF): Riding The Battery Hype, Or Perhaps Not...

There is a kind of company that is the most dangerous thing in investing. It is not the fraudulent company. It is not the obviously bad company with terrible products and incompetent management. Those are easy — you just avoid them. The truly dangerous company is the one with a
The Beautiful Trap: Why I'm Passing on The Hour Glass (SGX: AGS)

There’s a peculiar kind of investment that keeps you up at night — not because it’s bad, but because it’s genuinely good. Good enough to admire. Not good enough to buy.
The Diamond in the Rough That Isn't Quite Yours: Why I Passed on Boustead (SGX: F9D)

There is an old saying that investors have borrowed, bent, and quoted so many times it has nearly lost its sharpness: a bird in the hand is worth two in the bush. Warren Buffett, characteristically, gave it a precise mathematical form. The value of any investment, he wrote, is determined by three questions:
The Schoolteacher's Secret Insurer: Why Horace Mann (NYSE:HMN) Is Sitting on My Watchlist

“The stock market is a device for transferring money from the impatient to the patient.” — Warren Buffett

The Dormitory King That Couldn't Leave Home: Why I Passed on Centurion (SGX: OU8)

There is a deceptively simple question that Warren Buffett borrowed from Aesop’s ancient fable, and has repeated across decades of shareholder letters: “How many birds are in the bush? How sure are you they’re there? And how long until you get them out?”
The Children's Place: A $90 Million Bet on a Company That Used to Be Worth $2 Billion (NYSE: PLCE)

There is a classic scene in every heist movie. The detective walks into a room, sees the chalk outline, the scattered evidence, the broken window, and immediately knows something went terribly wrong long before anyone called the police. You do not need the full autopsy report to read the body.
World War 3 In Iran and Why Oil Price Will Continue Increasing — It Arrived Sooner Than Anyone Expected

This is Part 2 of a continuing analysis of California Resources Corp (CRC). Part 1 built the foundational investment case: a company trading at $44 per share against a conservative intrinsic value of $108–$156, built on 567 million barrels of proved developed oil reserves in California, and a management team spending hundreds of millions buying back its…
The Most Overlooked Oil Company in America — And Why That Might Be the Opportunity of the Decade

Date of analysis: 28 December 2025
The Art Of Saying No - MYPS: Playstudios Inc

PLAYSTUDIOS (MYPS) is a Las Vegas-based mobile gaming company that operates free-to-play social casino games and a loyalty platform called playAWARDS, which lets players redeem points for real-world rewards at places like MGM Resorts, Norwegian Cruise Line, and Wolfgang Puck restaurants. On the surface, this sounds like a clever moat. A loyalty program.…
The Art Of Saying No - UGP: Ultrapar Participacoes S.A (Part 2 of 2)

Question 2: How Certain Are You?
The Art Of Saying No - GLIBK: GCI Liberty Inc

Picture this: a single telecommunications company — the dominant one — serves over 200 communities scattered across the largest state in the United States. Alaska. A state with just over one person per square mile. A state where 39% of residents are underserved by broadband. A state where, until recently, some villages received internet via satellite li…

The Art Of Saying No - UGP: Ultrapar Participacoes S.A (Part 1 of 2)

The Setup: A Value Investor Dream?


The Art of Saying No - RIG: Transocean LTD

“The difference between successful people and really successful people is that really successful people say no to almost everything.” — Warren Buffett
The Art of Saying No - KPRX: Kiora Pharmaceuticals Inc

“The difference between successful people and really successful people is that really successful people say no to almost everything.” — Warren Buffett
The Art of Saying No - DNUT: Krispy Kreme Inc

“The difference between successful people and really successful people is that really successful people say no to almost everything.” — Warren Buffett

🎓 A Business Strategy Primer Part 7 - Learning From Great Companies

The Billion-Dollar Playbook: How Market-Based Management Powered Koch Industries’ Unstoppable Rise
The Art of Saying No - MRX: Marex Group PLC

“The difference between successful people and really successful people is that really successful people say no to almost everything.” — Warren Buffett


The Art of Saying No - SFIX: Stitch Fix Inc

“The difference between successful people and really successful people is that really successful people say no to almost everything.” — Warren Buffett
🎓 A Business Strategy Primer Part 2 - Brainstorming Solutions With Value At The Core

Creating An Irresistible Offer
The Art of Saying No - TDOC: Teladoc Health Inc

“The difference between successful people and really successful people is that really successful people say no to almost everything.” — Warren Buffett

The Art of Saying No - MDU: Mdu Resources Group Inc

“The difference between successful people and really successful people is that really successful people say no to almost everything.” — Warren Buffett


The Art of Saying No - AFCG: Advanced Flower Capital Inc

“The difference between successful people and really successful people is that really successful people say no to almost everything.” — Warren Buffett
The Art Of Saying No - VYX: NCR Voyix Corp

“The difference between successful people and really successful people is that really successful people say no to almost everything.” — Warren Buffett
The Art of Saying No - VSTS: Vestis Corp

“The difference between successful people and really successful people is that really successful people say no to almost everything.” — Warren Buffett

🛢️Basic Energy Primer Part 2 - Business and Competitive Landscape

The Man Who Bet Everything on Being Wrong
The Art of Saying No - CISS: C3is Inc

“The difference between successful people and really successful people is that really successful people say no to almost everything.” — Warren Buffett
The Art of Saying No - PSHG: Performance Shipping Inc

“The difference between successful people and really successful people is that really successful people say no to almost everything.” — Warren Buffett

The Art Of Saying No - MAGN: Magnera Corp

The Magnera Corporation Analysis Nobody Asked For (But Everyone Needs)
The Art of Saying No - CHR: Cheer Holding Inc

“The difference between successful people and really successful people is that really successful people say no to almost everything.” — Warren Buffett
The Art of Saying No - WIMI: WiMi Hologram Cloud Inc.

“The difference between successful people and really successful people is that really successful people say no to almost everything.” — Warren Buffett
⚡️Alternative Energy Primer Part 3 - Industry and Sector Technicals

The €2.2 Billion Mistake That Revealed Everything
⚡️Alternative Energy Primer Part 2 - Business & Competitive Landscape

The Shipwreck That Changed Everything

🏥 A U.S. Health Insurance (Managed Care Organizations) Sector Primer

1️⃣ Industry Fundamentals & Macro View

